8 Human Population as Environmental Stressor
Jason Kelsey
Chapter 7 described some natural sources of stress. Now we begin to study ways humans can adversely affect organisms and ecosystems (i.e., anthropogenic sources of stress). In Chapter 8 we consider the causes and consequences of rapid human population growth and increased demand for resources. Upcoming chapters will build on those foundations, and we will see how limitations on available materials like fertile soil, space, and clean water and air are linked to the number of people on Earth and their standards of living.
Key concepts
After reading Chapter 8, you should understand the following:
- How and why the current rate of growth of the human population is much higher than that seen in the past
- What is meant by exponential growth
- Different ways to express the growth of a population
- Why demographic shifts in populations are important
- The factors that influence different rates of growth and resource use in different countries
- What is likely to happen to the size of the human population in coming decades
- How we might adapt to or mitigate the effects of a growing population and increasing expectations of resource availability
Chapter contents
8.1. A Brief History of Human Population Growth
8.2. Measuring Growth
8.3. Factors Affecting Population Size
8.4. Distribution of People, Growth, and Resource Use
8.5. What Does the Future Hold?
8.6. Can We Minimize the Stress From Human Population?
The Chapter Essence in Brief
8.1. A BRIEF HISTORY OF HUMAN POPULATION GROWTH
8.1.1. Numbers and growth rate were low until the middle 1800s
Evidence suggests modern humans have been present on Earth for about 200,000 years. For nearly all that time, the size of the population was low relative to that seen today: most researchers hold that the number of people in the earliest days was only in the tens of thousands. By about 10,000 BC, it had likely increased to a few million. The size of the human population then grew slowly, up to 1 billion by the year 1800[1].
8.1.2. Population size has increased dramatically since the 1800s
In about 1850, the rate of growth began to rise. By 1910, it became constant, 1 to 2% each year (the 2022 rate was 1.03%[2]). Put another way, the human population has grown exponentially during the past century or so (see Box 8.1 for more about exponential growth). This is a concept we encountered during our discussion of positive feedback (Chapter 2).
Box 8.1. Exponential growth: filling up in a hurry
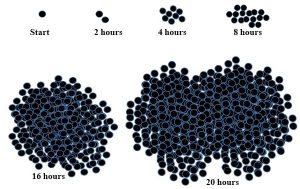
As a population grows, positive feedback will cause its size to increase at an ever-increasing rate. Exponential growth is one result of positive feedback, a phenomenon that has driven the human population to expand rapidly during the past century. Bacteria provide an even more dramatic demonstration of the power of exponential growth than do humans. Imagine we add a single microscopic cell to the middle of a petri dish and then watch what happens. If our hypothetical species doubles in size every two hours (a reasonable rate for bacteria), it would not take long for it to grow into a population large enough to visibly fill the entire surface of its artificial home. How can this be? Well, one cell splits into two, then two become four, then eight, and so forth. In just 20 hours one cell can become 1024 cells, and over one million cells would be present after 40 hours! The figure below models how fast all of this occurs. Note that each dot represents one cell and that all doublings are not pictured. You should also realize a petri dish would contain a fixed amount of space and nutrients, meaning the bacteria would eventually outgrow their resources and die.
Putting it rather informally, with growth, more people become capable of producing more people, and the population gets ever larger. Figure 8.1 is a graph of human population with time. Among other important trends, it shows how different were growth rates before and after 1850. The number rose from 300 million in the year 1 AD to 1 billion some 1800 years later[3], but then another 7 billion were added in only the next 222 years.
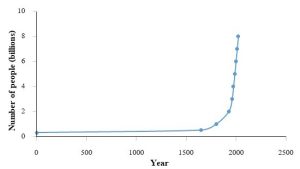
Table 8.1 provides another way to envision growth: it quantifies the increase from 1804 to the present in increments of 1 billion people and includes projections to the end of this century (data for the years 2050 and 2100 come from the United Nations[4]). Note that, although the overall number of people is expected to go up until at least 2100, the rate at which that change occurs will likely slow. Box 8.2 summarizes some important facts gleaned from Figure 8.1 and Table 8.1.
Table 8.1. Growth in increments of 1 billion people.
| Year | Population (billions) |
|---|---|
| 1804 | 1 |
| 1927 | 2 |
| 1960 | 3 |
| 1974 | 4 |
| 1987 | 5 |
| 1999 | 6 |
| 2011 | 7 |
| 2022 | 8 |
| 2050 | 9.7 |
| 2100 | 10.4 |
Box 8.2. Some important facts about the human population
The figure and table above contain a lot of data about the size and growth of Earth’s human population. Some of the most noteworthy conclusions and trends are further summarized here.
1. Total population in fall of 2022: 8 billion
2. Annual growth rate in 2022: 1.03% (a net addition of over 80 million people per year)
3. Annual growth rate during the 20th Century: a range from 0.8% (1900) to 2.1% (1962)
4. Net number added during the 20th Century: 4.5 billion (i.e. an increase from 1.6 to 6.1 billion)
5. Years to double in size from 1 to 2 billion: 123 (the year 1804 to the year 1927)
6. Years to double from 4 to 8 billion: 48 (the year 1974 to the year 2022)
8.2. MEASURING GROWTH
Demographers, scientists who study the characteristics of populations, can calculate changes to the size of the human population using the two methods described here.
8.2.1. Growth rate
Growth rate is an expression of the net change in the total number of living individuals within a given period (generally per year). By convention, this information is expressed as number per thousand people, in a fraction such as 9/1000 or -2/1000. Growth rate is calculated using simple mathematics:
Growth rate = birth rate – death rate.
For instance, in 2020, the global birth rate was 18.1 / 1000 and the death rate was 7.7 / 1000[5]. Put another way, for every 1000 people in the world on January 1, 2020, 18.1 were added by December 31, 2020; 7.7 of every 1000 died during the same period. So, net growth for 2020 =
18.1 / 1000 – 7.7 / 1000 = 10.4 / 1000.
What does this answer mean? For every 1000 people at the beginning of the year, there were 1010.4 people at the end of the year. Note that net growth would be affected even if only one of the terms changed. Imagine if birth rate remained at 18.5 / 1000, but death rate declined to 6.7 / 1000. In such a case, growth rate would increase to 11.8 / 1000. Similarly, if inputs and outputs changed by the same amount, say, each was reduced by 1, then growth rate would be constant (i.e., 10.4 / 1000). Of course, the relative size of different age groups would change even as the total number was unaffected. In our example involving constant birth rate with declining death rate, there would be more older people and fewer younger ones (a situation that is increasingly affecting many nations, as we will see later). Further complicating matters, since rates of birth and death, as well as immigration and emigration, are not the same everywhere, growth rates in some nations are higher than the global average and some are lower (even below 0 where populations are contracting). We will return to a discussion of Earth’s heterogeneous population growth shortly.
8.2.2. Total fertility rate (TFR)
Unlike growth rate, which applies to the entire human population, TFR is the number of children born to an average woman during her childbearing years (formally defined for the purposes of this calculation as ages 15 – 49). The global fertility rate for 2024 was 2.2, although, as we noted for growth rate, it varied considerably among nations[6]. Three additional points merit brief attention here. First, unlike growth rate, this measurement is a direct way to quantify the number of births per woman and does not consider the number of men. Second, TFR in a year can be used to project future growth of a population. For example, since the fertility rate in the United States was 3.5 in the 1960[7], an average woman born that year gave birth to 3.5 children by the time she turned 49; the total growth of the population during that period could therefore be predicted ahead of time. The TFR for a woman born in the U.S. was 1.4 in 2020[8], suggesting a lower rate of growth in the future. Finally, since two parents are required to produce each child, a fertility rate of 2.0, known as the replacement rate, would in principle yield a stable population. Each set of two parents is exactly replaced by their two offspring, so the total number of individuals does not change. In practice, the actual global replacement rate is generally understood to be approximately 2.1 for several reasons, including the fact that some people die before they produce any offspring. Due to differences in life expectancy and other factors (more below), replacement rates in individual countries can be higher or lower than that average of 2.1.
8.3. FACTORS AFFECTING POPULATION SIZE
Whether the size of the human or any population increases, decreases, or remains constant ultimately depends on the relationship between rates of input and output of individuals. Those additions and subtractions are, in turn, influenced by a number of complex forces.
8.3.1. Inputs
Globally, births are the only source of human beings. Locally, though, immigration also adds people to the population of a country. Rates of both births and immigrations, therefore, should be added together to calculate total growth rate in any area.
Birth rates
The annual number of live births per thousand people has varied with time, increasing and decreasing, and differs among regions and countries for several reasons.
Infant mortality. Defined simply, this term relates to the rate at which pregnancies end in a stillborn baby; that is, lower numbers of infant mortality indicate higher numbers of live births. Globally, this rate has declined dramatically during recent decades from 93 / 1000 births in 1990 down to 37 / 1000 births in 2020[9]. Individual countries have changed to different extents, though. For example, per 1000 births, it dropped from 11 to 6.3 in the United States, 6.3 to 2.5 in Japan, 7.7 to 3.0 in Monaco, and 146 to 29 in Bangladesh during that period[10]. This decline in mortality largely has been the result of increased access to quality medical care.
Cultural considerations. A detailed exploration of this topic is beyond our scope, so we will only make a few brief comments here. Broadly, it is fair to say that countries with a tradition of large families tend to continue that trend with each subsequent generation, but many factors affect attitudes and fertility. Differences in values, social structure, religion, education, and level of development are among the variables influencing birth rate. For example, as rural, agricultural economies transition to urban, industrial ones, birth rates generally decline. Also important are levels of education and empowerment of women: as these increase, sizes of families very often decrease.
Immigration
The number of new individuals present in a country increases each time a new person arrives from an outside place. Like birth rates, immigration rates are unequal among Earth’s nations and are influenced by many forces including the perception that entering a host country will improve economic opportunities, safety, health, and freedom. In other words, countries most affected by immigration are those that are seen to enhance the lives of people who move to them.
8.3.2. Outputs
Death is ultimately responsible for removing human beings from the global system, but both mortality within and emigration from individual countries must be considered to determine local rates of output.
Death rates
Each human being born will die eventually. However, the length of time a typical person lives—commonly referred to as average life expectancy—is an important variable affecting overall population size and its rate of growth. Notably, if the rate at which people die goes down, the total number of people alive at any one time goes up (review equation 1 above to visualize the effect of declining death rate on total growth rate). The difference in growth rates before and after 1800 are in large part a consequence of declining death rates with time (review Figure 8.1 and Table 8.1).
Many factors contributed to the slower output of humans from Earth’s system during the past 150 years. Although these changes certainly did not affect all regions or people equally, they still led to improvements in average survival, and life expectancy and can be linked to observed increases in population size. Of course, unexpected stressors and events can complicate our calculations. See Box 8.3 for information about the way the COVID-19 pandemic affected human population.
Box 8.3. What about COVID?
The effects of the pandemic of 2020 (and beyond!!) on population growth have yet to be completely understood, but some tentative conclusions can be drawn. First, the global growth rate of 2020 was less than 1 % / year for the first time since 1950[11]. Second, average global life expectancy dropped between 2019 and 2021, although the story is nuanced. Some areas—for example, Mexico, Russia, and Lebanon—saw a 4-year-decline in predicted lifespans of babies born in 2021, whereas others—for example New Zealand and Australia—actually saw an increase in life expectancy of about 1 year[12]. Third, although the numbers are difficult to determine with a high degree of certainty, The World Health Organization (WHO) estimates that the pandemic led to about 15 million excess deaths (i.e., deaths that would not have occurred without COVID-19) between January 2020 and December 2021. Note this number includes deaths directly and indirectly attributed to COVID and is therefore higher than the 6.6 million officially reported to the WHO[13]. Fourth, the way the pandemic has influenced fertility is rather difficult to assess. On the one hand, isolation can limit access to contraception, but, on the other, economic stress tends to depress fertility. At this point, no obvious trend can be identified[14]. Demographers continue to study the problem.
Improvements in medicine. Human healthcare has dramatically improved during the past century. For example, advances in the treatment of cancers, infections, heart disease and numerous other life-limiting conditions have contributed to accelerated population growth by slowing the rate of death. Three other critical changes are briefly described here.
Knowledge about causes of infections
As noted in Chapter 3 (especially Box 3.5), human understanding of infectious disease grew substantially in the mid and late 1800s. Up until that time, the role of microorganisms in causing conditions such as cholera and tuberculosis, to name just two important historic and deadly diseases, was not known. Consequently, simple precautions we take for granted today such as bathing, disinfection of medical instruments, and other steps that slow the spread of germs from person to person were not employed. As remarkable as it might seem to us, with few exceptions, physicians did not even routinely wash their hands between patients until at least the late 1800s! The study of germs and ways to combat them led to appreciable changes in the health (and likelihood of survival) of both sick and healthy people.
Antibiotics
We learned in Chapter 5 that the discovery of antibiotics in the 1920s profoundly changed the way we treat cholera, strep throat, syphilis, and numerous other diseases caused by bacteria. Drugs such as penicillin cured many people who would have likely died in previous years and contributed to an increase in the size of the human population. As we know, though, there are risks with antibiotic use, notably the development of antibiotic-resistant bacteria (Chapter 5).
Vaccinations
The administration of vaccines to protect against diseases including smallpox, polio, measles, rubella, and tetanus made a profound contribution to life expectancy during the 20th Century. More recently, the rapid development and distribution of vaccines against the virus responsible for COVID-19 similarly protected millions of people against serious cases of the disease. Review Boxes 1.2 and 2.1 for more about the benefits of vaccines.
Improvements in water quality. This factor is related to the previous one, as we learned in Chapter 3. An understanding of the ways biological, chemical, and physical pollutants can affect the health of people consuming them (mid and late 1800s) helped usher in better management and protection of drinking water supplies. We will return to the topic of water quality in Chapter 11.
Improvements in nutrition. Agriculture has been around for about 12,000 years (Chapter 9), but increases in the availability of food due to farming and distribution systems only provided much more consistent access to essential nutrients during the past century or so. These changes drove better growth and development, immune function, and prenatal care for many, if not all, peoples.
Improvements in safety. The list of ways human lives have become more safe with time is quite long. Keeping things appropriately brief for our purposes, various laws and trends affecting everything from cars to homes to workplaces to highways have reduced injuries and deaths. Strict regulations on food and drug safety have similarly enhanced both quality and length of lives and contributed to population growth (more about food safety can be found in Chapter 15).
Emigration
As we saw for immigration, this phenomenon varies from country to country and can profoundly affect population growth rate. Among the many factors affecting it are stability of government, civil war, disease, drought and other adverse environmental changes, and poverty. In simple terms, people tend to exit countries undergoing turmoil and enter countries assumed to provide the possibility of a better life.
8.3.3. All inputs and outputs affect local growth rate
Note that equation we saw in section 8.2 can be modified to account for all inputs and outputs in a specific area. Thus,
Growth rate of a region = (births + immigration) – (deaths + emigration)
8.4. DISTRIBUTION OF PEOPLE, GROWTH, AND RESOURCE USE
Human population growth rate and density vary among regions and nations and have also changed with time. Additionally, standards of living, values, and resource use also differ—often by a great deal—from place to place. Here we will briefly examine the major trends and possible explanations for the disparities we observe.
8.4.1. Human population distribution and wealth are heterogeneous[15]
Population size and density vary enormously among (and within) regions, as is well known. More than half of Earth’s 8 billion humans live in Asia, and two nations, China and India, each are home to around 1.4 billion people. The United States, with a population of about 340 million, is a somewhat distant third. On the other end of the spectrum are countries such as Saint Barthelemy, Montserrat, and Vatican City with populations of 7,103, 5,414, and 1,000, respectively. Realize that the most populous nations are not necessarily the ones with the highest population density, though. For example, Russia has the 9th largest population (142 million) but one of the lowest population densities, whereas Monaco is one of the most densely populated nations while being among the least populous (about 31,000 people). Standards of living and resource use per person are also uneven; note, though, that there is no consistent relationship between the number of people and affluence in an area. Returning to the nations we just compared: Russia, the much more populous of the two, is ranked 72nd in the world in per-capita wealth (as measured by GDP[16] / person, a reasonable reflection of standard of living), whereas tiny Monaco is the second wealthiest per person (the U.S. and China are ranked 17 and 102, respectively, in terms of GDP / person).
8.4.2. Levels of development and wealth often predict population growth
Earth’s peoples and nations can be categorized and grouped using several different criteria. One common, if somewhat crude, system is to divide the world into groups based on per capita income and level of industrialization or development. This strategy is often helpful because it can be used to understand important factors influencing past growth as well as help predict what will occur in the future.
Nations with the highest level of development
These developed countries have relatively high per-capita income, levels of industrialization, infrastructure, life expectancy, education, and overall standard of living (i.e., enjoy relatively high GDP / person). Generally, they tend to be democratic and control a large amount of the world’s wealth. Countries such as the United States, Canada, Japan, Australia, Israel, South Africa, most of Europe, and a few other places in Asia, South, and Central America are on this list[17], [18]. Although the developed world is not uniform in this regard, growth rate here is relatively slow, at or below the global average. In fact, in some cases, fertility rates are appreciably lower than replacement; Japan (1.38 child / woman) and Germany (1.57)[19] provide two examples of developed nations with shrinking populations. Moreover, as a group these nations make only small contributions to global population growth—between 10 and 20% of human births occur in the developed world—and its relative contribution is expected to shrink during the coming decades[20].
Nations with lower levels of development
The list of developing nations is longer than that for the developed world and includes many nations in Africa, portions of South and Central America, some Middle Eastern and Gulf states, China, India, and other parts of Asia[21],[22]. These countries are typically grouped together here because, relative to the developed world, they have lower per capita incomes, levels of industrialization, infrastructure, life expectancy, education, and standards of living. They also hold less wealth and tend to be less democratic. This second category is itself rather heterogeneous, though, including a wide range from countries such as Somalia and Niger, arguably on the low end of development, to a place like China, a rapidly changing, advancing nation that, depending on the method used to make the measurement, has either the highest or second-highest GDP on Earth[23]. Fertility rates also vary in the developing world, but they are typically at or higher than the global rates, in some cases by a great deal. For example, Niger and Somalia are two of the fastest growing nations on Earth (fertility rates of 6.8 and 5.2, respectively[24]) while being two of the poorest. On the other hand, Bangladesh, one of the least developed nations, defies the overall trend and has a fertility rate of 2.1[25] (as we will see in more detail shortly, China’s is even lower). Despite the less-than-perfect relationship between development and growth, it is fair to say that nations on this list are home to the bulk of global population growth: on the order of 80 to 90% of births occur here, and the U.N. population division expects the proportion to increase in the future[26].
8.4.3. Level of resource use per person increases with level of development
It is likely unsurprising to hear that, with increasing per-capita incomes, expenditures on energy, technology, and food go up as well. Put another way, resource use per person is generally higher in the developed world than it is in the developing world. Differences in food consumption provide a good example of the way affluence affects access to resources. For example, according to the United Nations, an average person in Europe and North America consumes around 3,600 calories per day whereas the number for Africa is 2,600[27](the amount needed for survival varies but is generally between 1,800 and 1,900 per day[28]). Those regional numbers do not reflect the range, though: people in the United States have access to about 3,770 calories per day (nearly 50% more than is needed for survival) whereas availability in the Central African Republic averages about 1,790 calories per day[29]. Non-food energy usage is similarly unequal. Consider petroleum: although the United States is home to just 5% of the world’s population, it accounts for 20% of the use of this important energy source[30] (we will see much more about energy supply and demand in Chapter 10).
8.4.4. Nations develop and change
The relative contribution a nation makes to global population growth, as well as its share of resource use, can vary substantially with time. After all, the term developing implies a dynamic situation: a country may undergo dramatic changes to its infrastructure and standard of living—along with its cultural values and other factors affecting birth rate—such that it might look very different today than it did mere decades previously. As suggested earlier, China provides one particularly vivid example of such rapid evolution. In the 1960s it had a fertility rate higher than 6 and was one of the poorer nations on Earth. A mere 30 years later, its population growth rate had dropped below replacement and its control of the world’s wealth began to increase dramatically. See Box 8.4 for more information about fertility, demographics, and development in the country that has the largest population on Earth.
Box 8.4. China: slowing population growth, increasing wealth
As is well known among many people, this population grew rapidly during the second half of the Twentieth Century to become the largest on Earth (just over 1.4 billion people in 2022[31]). Fertility rates were between 5 and 6 each year from the 1950s until the early 1970s, between 3 and 4 in the 1970s, between 2 and 3 in the 1980s, and finally dropped below 2 in the early 1990s[32] (in 2022 the number was about 1.45[33]). Although many forces were responsible for this rapid transformation, the so-called “One Child Policy” enacted by the Chinese central government in 1979 had the biggest impact. In short, couples were forbidden by law from producing more than one child. Many exceptions were ultimately allowed, and the law was not enforced uniformly. However, it certainly did bring about the goal, a profound decline in birth rates (the policy was more or less eliminated in 2016). Note that several unexpected and undesirable consequences resulted from the law, including gender inequities (many observers report that some couples wishing to ensure that their one child was male abandoned or killed female infants, actions most will likely view as profoundly objectionable on their own, but ones that also created a much larger pool of young men looking for wives than there were wives to go around in subsequent decades). The population also aged a great deal, meaning that the proportion of older people has grown relative to that of younger people—among other concerns associated with this change is the fact that an ever-dwindling workforce (as a fraction of the total population) must support an ever-expanding number of elderly people. At the same time this substantial decline in population growth rate occurred, China’s economy expanded rapidly, in recent years, far faster than most other nations, and the standards of living of most of its residents improved. The current government's plans include further expansion and encouragement of domestic consumption[34]. So why is China generally still categorized as a developing country? The answer is largely a function of its low per-capita income, ranked 102nd in the world[35], lower than both many nearby and distant countries. In any case, we should expect that, assuming it follows the usual trajectory, continued development will inevitably increase China's resource use and environmental impact.
Acknowledging that not all cultures and peoples have the same goals, values, and aspirations, it is still broadly fair to say that societies tend to progress through similar stages of advancement, albeit at different times, and become more and more technologically advanced, urbanized, and affluent. So, like China, many nations that have historically experienced low levels of resource use and industrialization are currently in a state of transformation, moving them toward those seen in the developed world. What are the consequences of worldwide increases in standards of living and expectations? Put simply: human demands on resources exceed the planet's capacity to supply them. We can visualize the consequences of ever-increasing development among Earth’s nations by asking a simple question: how much space would be required if everyone enjoyed the same standard of living as those in developed countries (say, the United States)? Taking into account resources necessary to produce the food, building materials, and energy demanded per person—the so-called ecological footprint of an average U.S. citizen—the answer is: the equivalent of just over five planet Earths[36] (see Box 8.5 for a little more about resource use in affluent countries). On the other hand, the same calculation suggests that if everybody lived like citizens of Bangladesh, Uganda, or India, less than the equivalent of one Earth would be needed to meet demand for resources. As with any measurement, you should realize that there is a fair amount of uncertainty associated with this one, as well as some disagreement among scientists as to the validity of the assumptions upon which it is based. However, it highlights an important conundrum: people on Earth seem to aspire to standards of living that are simply unsustainable. Creative decision making and solutions, as well as changes to our expectations about how we should live, will be needed to avoid shortages and conflicts in the future (more about this challenge is presented in an upcoming section).
Box 8.5. Why the United States?
You might be asking yourself why the United States is singled out in this discussion of consumption and ecological footprint. The short answer is: it is the third most populous nation on Earth and has one of the highest rates of resource use. Additionally, it would be very difficult to argue that it is not an influential country—many of its values and habits have been embraced and mimicked for decades. In other words, it often sets the pace for what other nations do. So, it is a very relevant and at the same time instructive example. All that said, you should be aware that consumption rates in some other nations are also quite high. In terms of per-capita ecological footprint, The United States is actually only fifth highest on the list behind countries such as Luxembourg and Qatar (8.2 and 9.0, Earth's required, respectively—see the main text for more about the calculation).
8.5. WHAT DOES THE FUTURE HOLD?
What lies ahead? Will the human population continue to grow exponentially or will its rate of increase slow? Might the total number of people even decline? How will ever-increasing demand for limited resources affect numbers of people and quality of life? Here we will briefly address these important and challenging questions and use what we have learned to predict the future of humans on Earth.
8.5.1. Will our population just keep getting bigger and bigger?
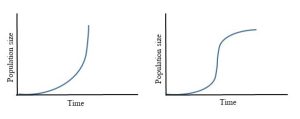
Near the beginning of this chapter we learned how current human population growth is exponential (review Figure 8.1, above). You should realize, however, that this trend cannot continue forever. At some future time, the rate must inevitably slow (perhaps even fall below 0) because the supply of resources will not be able to keep up with the demands for them. If you recall that Earth is closed with respect to materials, you will see how no population can continue to increase in size indefinitely. Fixed amounts of space, nutrients, and water simply limit the absolute number of organisms that can be supported at any one time. Returning to a concept we first encountered in Chapter 1, we would say that a population will continue to expand until it reaches its carrying capacity. Importantly, exponential growth can occur only under ideal conditions, principally, so long as necessary resources are available in excess. Plotted on an x-y graph, we see a J-shaped curve (Figure 8.2a). Once a population approaches its carrying capacity, though, growth rate slows, yielding an S-shaped, or logistic, curve (Figure 8.2b).
We know that the human population is ultimately bound by the same rules and limitations as any other on Earth: it cannot increase exponentially forever. Just how big the human population will get and when growth will reach the flat phase of the logistic curve (review Figure 8.2b), though, is unclear and the subject of a fair amount of debate and disagreement. Various researchers have offered estimates of the maximum number of people that can be sustained by this planet. On the low end, the number is probably about 2 billion people, assuming everyone lives like a citizen of a developed country such as the United States and perhaps as high as 40 billion if all were to meet only basic needs for survival (recall the discussion above about ecological footprint and the number of Earth equivalents required under various scenarios). Assuming everybody will aspire to higher standards of living than mere subsistence, the number is almost certainly appreciably lower than our current 8 billion. More about human carrying capacity is presented in Box 8.6.
Box 8.6. Will we exceed carrying capacity? Are we doomed?
What will happen if population keeps expanding at a high rate? Might we reach a point at which disaster will strike? Many have weighed in on these questions, but perhaps the most famous prediction was offered over 200 years ago by Thomas Malthus, an economist and English cleric. In short, Malthus concluded that humans’ drive to reproduce will ultimately overwhelm Earth’s resources and lead to shortages, war, and mass death and destruction[37]. He has his critics. For example, many demographers and ecologists contend his premise is flawed because humans would never allow their population to grow to intolerably high levels. In other words, growth rate will slow due to negative feedback (Chapter 2). Others hold that our continued growth and existence is evidence his prophecy was false; in fact, there are even a few who think technology and innovation will allow us to grow indefinitely to many tens of billions of people. On the other hand, he has his followers, those who embrace his overall vision. They contend doom is inevitable, but we just have not yet reached the crisis point he imagined.
8.5.2. Can we project what will happen?
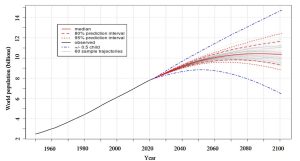
According to the United Nations Population Division, growth rate is likely to enter the flat phase of the logistic curve during the coming decades, resulting in a human population of about 10.4 billion people by the year 2100[38] (review Table 8.1). Keep in mind that this projection is based on many difficult-to-predict variables and, therefore, is only a well-informed estimate. For example, the slowing of growth depends on expectations we noted earlier, namely that education, empowerment of women, urbanization, and industrialization will all increase and that fertility rates will decrease. Figure 8.3 illustrates possible patterns of growth that could occur between now and 2100 and the levels of uncertainty associated with this prediction. Note that most reflect slowing growth, however little change from our current trajectory is also possible.
8.6. CAN WE MINIMIZE THE STRESS FROM HUMAN POPULATION?
Before we end this chapter, we should consider a final question: what can we do to reduce the effects of human population on Earth’s environments and organisms? The answer is quite complicated, but we will briefly suggest a few potential solutions and the challenges associated with them.
8.6.1. Make fewer people?
On the surface, this strategy appears straight forward and reasonable: if the human population were smaller, its impact would be, likewise, smaller. We might be tempted to encourage (or even coerce, depending upon how authoritarian we care to be—review Box 8.4) lower birth rates to accomplish our goal. Furthermore, we could also conclude that since 90% of new growth occurs in the developing world, our reduction efforts should focus on those countries with highest fertility rates to relieve the stress brought on by humans. Unfortunately, simply producing fewer babies (no easy task under any circumstances, as we will explore below) would likely not bring about all the benefits we seek because numbers alone do not reliably indicate the adverse impact a country can have on global natural systems. Recalling that per-capita resource use in developing countries is generally far less than it is in developed countries (e.g., the average ecological footprint in, say, Bangladesh vs. that in the United States), we see that lower birth rates alone would not solve the problem. Importantly, a person born and raised in a typical family in the developed world will have greater opportunity to affect global systems than one in the developing world for at least three reasons.
1. Higher level of resource use
We know resource use per person is far from equal on Earth. So, although the fertility rate is over two times higher in a place like the Democratic Republic of the Congo than it is in the United States, babies born in each place will likely lead very different lives and use vastly different amounts of food, water, building materials, fuel, and space.
2. Greater access to technology
Industrialized nations use more fuel for transportation, computers, cell phones, and the like than do agrarian nations. As we will see in greater detail in Chapters 10 and 14, the production of usable power almost always releases air pollution into Earth’s atmosphere, and those products of combustion move great distances from their sources via natural processes. So, a person driving a car in the United States has a greater capacity to remotely and directly affect people on other continents than does a person lacking access to a motor vehicle in a place such as Bangladesh or Haiti.
3, Longer life expectancy
Developed countries generally enjoy lower death rates (review the growth rate equation)—that is, longer lives—than do developing countries. Average citizens in the United States (life expectancy as of 2020 was 77 years), therefore, have even greater opportunities to affect natural systems because they use more food and fuel and so forth for a longer time than do people in the Democratic Republic of the Congo (60 years)[39]. Incidentally, these two countries do not represent the extremes on Earth, which are Monaco (89.5 years) and Chad (53 years)[40]. You will likely find it unsurprising that Monaco has the 2nd highest GDP / person whereas Chad is ranked 220th on a list of 229 reported by the United States Central Intelligence Agency. A few final comments are necessary here. First, average life expectancy for all nations is 72 years[41]. Second, life expectancy is higher for females than males (73 and 68 years, respectively[42]). Third and finally, we saw that life expectancy has generally increased in recently decades, although the COVID-19 pandemic led to a decline between 2019 and 2021[43].
Before moving forward, we should explore a potential downside to reducing the inputs of new humans into Earth's system. Assuming death rates continue to decline as standards of living and medical knowledge increase, people will be living longer and longer lives in the future. At the same time, a reduction in birth rates would lead to fewer and fewer young people as a proportion of a still-growing population. This demographic shift is already occurring in many countries around the world in any case (e.g, China, as described in Box 8.4), but a focused effort to bring down birth rates even further would make the change that much more pronounced. Why should we care if elderly people make up more and more of the human population? The answer is best illustrated by a look at governmental programs such as Social Security in the United States. Putting it into simple terms, this system was based on the premise that people of working age would contribute part of their wages to a fund used to pay money to retired people. It works well until and unless the number of people paying in dwindles relative to the number of people receiving benefits. As has been reported extensively by various media outlets during recent decades, unless changes are made, the money in the Social Security system will be insufficient to meet demand within 20 or so years (think systems analysis again: inputs cannot keep up with outputs). Reducing the numbers of new babies would certainly bring about some benefits in terms of demand for resources, but it could also change our ability to care for an ever-aging population.
8.6.2. Reduce demand by lowering expectations?
A second approach to minimizing human-caused stress on Earth’s systems is to reduce the use of food, energy, and other materials in countries with the highest per-capita resource use. For example, we noted earlier that an average resident of the United States consumes far more calories than are needed. The amount of edible food that goes uneaten in that country—wasted on farms, by markets, or by consumers—is also very high, estimated to be 30 – 40 % of all food produced[44]. Similarly, daily water usage per person far exceeds needs in many developed countries (e.g., 590 liters per day in the United States), but is near or below the minimum amount needed[45] in places such as India (143 L / day) and Mali (11 L / day)[46]. Recall from earlier discussions in this chapter that energy usage follows the same trends. Putting these and other considerations together, we can draw a fundamental conclusion: many more resources are expended by the most affluent nations than are required for survival. Modifications in usage patterns in these places as well as changing expectations worldwide could mitigate impending shortages.
8.6.3. Confront both size and consumption patterns?
It is likely evident by now that alleviating the stress caused by the human population requires a multi-faceted approach; no one strategy alone would be sufficient. Certainly, the increased demand created by more people is a concern, but so too is the high standard of living all the people on Earth expect and achieve. The nature of the problem can be summed up in one more equation:
total effect of the human population =
(effect of each individual) X (total number of individuals).
Notice that an increase in either the effect per individual or the number of individuals will increase the total effect. Given the discussion and data presented throughout this chapter, we can reasonably conclude that both of those terms are increasing now and appear to be trending upward into the foreseeable future. The overall effect of the human population, therefore, is likely to go up at a high rate.
8.6.4. Can we do this? Should we?
Addressing the stresses introduced by the human population is difficult, to say the least—potential solutions are complex, nuanced and, in many cases, unpalatable to people due to the cultural, religious, and social values they hold. Of course, we should also remember what a tough sell this is: reducing consumption when you are accustomed to plenty is simply no fun! Moreover, if we recall the trend in the developing world toward standards established by the United States and other developed countries (Box 8.5), a transformation that many view as a matter of justice and rights, the problem appears even more intractable. The data and evidence presented in this chapter, though, indicate that the time for careful and intensive consideration of the best ways to avoid shortages, conflict, and suffering is upon us.
THE CHAPTER ESSENCE IN BRIEF [47]
The size and behavior of the human population are two fundamental concerns of environmental scientists because they influence resource availability and environmental quality on a planet closed with respect to materials. Chapter 8 begins our study of the many anthropogenic sources of stress affecting natural systems as well as the health and survival of Earth's peoples.
Think about it some more...[48]
How and why has the growth rate of the human population changed during the past century?
How can feedback lead to exponential growth?
What are the effects of increased life expectancy on the growth rate of a population? What other effects could it have?
Which would have the greater adverse effect of Earth’s global ecosystem and resource availability: the addition of a baby to the developed world or the addition of that same baby to the developing world? You need to consider many variables as you ponder your answer to this question!
- Max Roser, Hannah Ritchie, Esteban Ortiz-Ospina and Lucas Rodés-Guirao. 2019. World Population Growth. Ourworldindata.org ↵
- United States Central Intelligence Agency (CIA). The World Factbook. 2022. www.cia.gov/the-world-factbook/ ↵
- Max Roser, Hannah Ritchie, Esteban Ortiz-Ospina and Lucas Rodés-Guirao. 2019. World Population Growth. Ourworldindata.org ↵
- United Nations Department of Economic and Social Affairs, Population Division. 2022. World Population Prospects 2022: Summary of Results. UN DESA/POP/2022/TR/No.3 ↵
- United States Central Intelligence Agency (CIA). The World Factbook. 2022. www.cia.gov/the-world-factbook/ ↵
- The United Nations. World Fertility Report. 2025. https://www.un.org/development/desa/pd/sites/www.un.org.development.desa.pd/files/undesa_pd_2025_wfr-2024_advance-unedited.pdf ↵
- Max Roser. 2017. Fertility rate. Published online at ourworldindata.org ↵
- United States Central Intelligence Agency (CIA). The World Factbook. 2022. www.cia.gov/the-world-factbook/ ↵
- 2022. Child Mortality of the Past. ourworldindata.org ↵
- 2022. Child Mortality of the Past. ourworldindata.org ↵
- United Nations Department of Economic and Social Affairs, Population Division. 2022. World Population Prospects 2022: Summary of Results. UN DESA/POP/2022/TR/No.3 ↵
- United Nations Department of Economic and Social Affairs, Population Division. 2022. World Population Prospects 2022: Summary of Results. UN DESA/POP/2022/TR/No.3 ↵
- World Health Organization, 2022. Global Excess deaths associated with COVID-19, January 2020-December 2021 ↵
- United Nations Department of Economic and Social Affairs, Population Division. 2022. World Population Prospects 2022: Summary of Results. UN DESA/POP/2022/TR/No.3 ↵
- All numerical data in this paragraph are from: United States Central Intelligence Agency (CIA). The World Factbook. 2022. www.cia.gov/the-world-factbook/ ↵
- Gross Domestic Product. For information about GDP and what it means, consult https://www.bea.gov/data/gdp/gross-domestic-product ↵
- United Nations. 2022. World Economic Situation and Prospects ↵
- United Nations Conference on Trade and Development. 2022 ↵
- United States Central Intelligence Agency (CIA). The World Factbook. 2022. www.cia.gov/the-world-factbook/ ↵
- United Nations Conference on Trade and Development. 2022 ↵
- United Nations. 2022. World Economic Situation and Prospects ↵
- United Nations Conference on Trade and Development. 2022 ↵
- United States Central Intelligence Agency (CIA). The World Factbook. 2022. www.cia.gov/the-world-factbook/ ↵
- United States Central Intelligence Agency (CIA). The World Factbook. 2022. www.cia.gov/the-world-factbook/ ↵
- United States Central Intelligence Agency (CIA). The World Factbook. 2022. www.cia.gov/the-world-factbook/ ↵
- United Nations Conference on Trade and Development. 2022 ↵
- United Nations. 2022. UN News. Health. Once again, US and Europe way ahead on daily calorie intake ↵
- Minimum daily requirements for calories, 2020. ourworldindata.org ↵
- Max Roser, Hannah Ritchie and Pablo Rosado. 2022. Food supply. ourworldindata.org ↵
- United States Energy Information Administration (EIA). 2022. www.eia.gov ↵
- United States Central Intelligence Agency (CIA). The World Factbook. 2022. www.cia.gov/the-world-factbook/ ↵
- Fertility rate, China. The World Bank. 2015. data.worldbank.org/indicator/SP.DYN.TFRT.IN?locations=CN ↵
- [footnote]United States Central Intelligence Agency (CIA). The World Factbook. 2022. www.cia.gov/the-world-factbook/ ↵
- United States Central Intelligence Agency (CIA). The World Factbook. 2022. www.cia.gov/the-world-factbook/ ↵
- United States Central Intelligence Agency (CIA). The World Factbook. 2022. www.cia.gov/the-world-factbook/ ↵
- Global Footprint Network. 2023. National Footprint and Biocapacity Accounts. www.footprintnetwork.org ↵
- Malthus T.R. 1798. An Essay on the Principle of Population. Chapter 1, p. 13 in Oxford World's Classics reprint. © 1998, Electronic Scholarly Publishing Project ↵
- United Nations Department of Economic and Social Affairs, Population Division. 2022. World Population Prospects 2022: Summary of Results. UN DESA/POP/2022/TR/No.3 ↵
- The World Bank. 2022. Life Expectancy at Birth, Total (years). data.worldbank.org ↵
- United States Central Intelligence Agency (CIA). The World Factbook. 2022. www.cia.gov/the-world-factbook/ ↵
- The World Bank. 2022. Life Expectancy at Birth, Total (years). data.worldbank.org ↵
- United States Central Intelligence Agency (CIA). The World Factbook. 2022. www.cia.gov/the-world-factbook/ ↵
- United Nations Department of Economic and Social Affairs, Population Division. 2022. World Population Prospects 2022: Summary of Results. UN DESA/POP/2022/TR/No.3 ↵
- United States Department of Agriculture (USDA). 2022. usda.gov ↵
- Defined as 50 – 100 L / day by the United Nations ↵
- United States Centers for Disease Control and Prevention (CDC). 2020. Water Use Around the World. cdc.gov ↵
- As you will find throughout this book, here is very succinct summary of the major themes and conclusions of Chapter 8 distilled down to a few sentences and fit to be printed on a t-shirt or posted to social media. ↵
- These questions should not be viewed as an exhaustive review of this chapter; rather, they are intended to provide a starting point for you to contemplate and synthesize some important ideas you have learned so far. ↵
A rapid increase in size of a property being measured due to positive feedback. It results from a constant rate of increase, i.e., a constant % of a growing number. See Chapter 2 for details.
In a system, current output accentuates or magnifies the effect of previous output. This type of feedback leads to change away from initial conditions. Compare to negative feedback. See Chapter 2 for more.
Refers to the many different kinds of microscopic organisms that are single celled and prokaryotic (i.e., do not possess distinct cellular organelles). Collectively, bacteria are extremely diverse, are the oldest organisms on Earth, and are critical to many environmental cycles and processes. See Chapter 3 for more.
A laboratory tool in which microorganisms such as bacteria can be grown. See Chapter 3 for context.
In demography, refers to the number of pregnancies that end in a stillborn baby; it is generally expressed as a number per 1000, e.g., 20 / 1000. See Chapter 8 for more.
Equal to the number of individuals of a species that can be sustainably supported by an ecosystem. See Chapter 1 for more.
