11 Human Water Usage and Pollution
Jason Kelsey
In Chapter 4 we learned about the cycling of many of Earth’s materials. Here we re-visit water and consider the effects of human activity on its storage and movement. Importantly, we will see how humans can reduce the availability of freshwater by using it faster than natural processes replace it and by adding pollutants to it. A review of the hydrologic cycle might be helpful as you begin to study Chapter 11.
Key concepts
After reading Chapter 11, you should understand the following:
- The different ways humans use water
- How tapping into reservoirs of the hydrologic cycle can lead to water shortages and conflicts
- Why people intentionally pollute water
- The many sources and types of water pollutants
- The strategies humans use to prevent and clean up water pollution
- How water conservation can be encouraged
Chapter contents
11.1. Water Usage by Humans
11.2. Water Pollution
11.3. Extending Our Supply of Useable Water
The Chapter Essence in Brief
11.1 WATER USAGE BY HUMANS
11.1.1. Categories by use type
As is well known, we need to consume water regularly to stay alive. However, the list of ways we utilize water goes beyond just basic survival. To begin our discussion, we will group these various applications into two categories: in-stream and off-stream use.
In stream
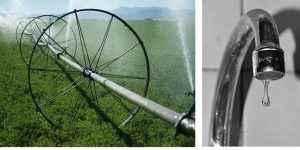
The use of water in place, that is, inside the reservoir in which it is naturally found, is known as in-stream water use. In these cases, water is not removed from oceans, rivers, or lakes. Instead, people travel to those reservoirs and carry out their activities within them. Hydroelectric power generation (Chapter 10), boating, swimming, transportation of goods, and fishing, are good examples of this type of usage (Figure 11.1).

Off stream
When water is removed from a reservoir and transported elsewhere, the activity is categorized as off-stream water use. We can further divide this group into consumptive and non-consumptive.
Consumptive. After it has been used, this water is not returned immediately to the reservoir from which it was taken. It is said to be consumed, although clearly that term is not accurate when we recall how water moves and is recycled among Earth’s systems. However, since the water will potentially travel along multiple pathways, including evaporation, freezing, and other processes described previously, before returning to a specific reservoir, for all practical purposes it is gone and unavailable for some period of time. For example, people drink water from a faucet and later flush some of that water down a toilet. It is likely that the water will then begin a long journey through facilities designed to clean and ultimately release it back into natural systems. Other applications appropriately categorized here include bathing, clothes and car washing, lawn watering, irrigation of agricultural fields (Chapter 9), and some industrial processing. See Figure 11.2 for two examples.
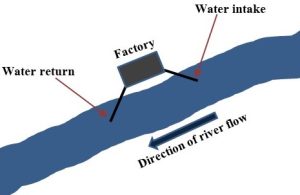
Non-consumptive. At times, off-stream use is followed by a near-immediate return of the water to its source instead of a tortuous trip along the many pathways of the hydrologic cycle. For example, an industrial site might be located near a river to take advantage of the cooling power of water. Water can be withdrawn from the stream and circulated in pipes around a piece of machinery to help maintain it at a low temperature. Once the water has absorbed some heat, it is very often released back to a downstream location on the same river (Figure 11.3). The use of water in power generation (Chapter 10) is another important example of this type of water use.
Power generation plants use water in this way as well (see Chapter 10 for more on power generation). It is worth noting that chemical pollution is generally not associated with the use of water to cool. However, the water can be returned to a river at a higher temperature than it was when withdrawn. See Box 11.1 to learn more about the phenomenon known as thermal pollution, the introduction of heat into a natural waterway.
Water used to cool an industrial process (as in Figure 11.3 in the main text above) is itself heated before it is returned to its reservoir. In some cases, the change in temperature between withdrawal and release can be dramatic, with increases of 10 °C (18 °F) or more possible. Should we care about a little heated stream water? Well, even a few degrees Celsius can have a big impact on aquatic ecosystems. First, warmer water cannot hold as much O2 gas as can cooler water, so aerobic organisms will suffer and sometimes die as a result of thermal pollution. The accumulation of organic waste from the die-off can contribute to further changes, including eutrophication. Second, toxic materials might behave differently at higher temperatures, endangering the health of organisms. Third, some organisms can only succeed under narrowly defined temperature conditions, so a small increase could permanently change the structure of downstream ecosystems.
11.1.2. Water demand outpaces supply
Competing demands for water
Given freshwater’s scarcity and value, it is probably not difficult to imagine how a single reservoir could be coveted by people with different priorities. A body of water that provides water for domestic use, for example, can also be in demand for activities such as irrigation, boating, fishing, and swimming. Conflicts over rights to water can take many forms, ranging from hard feelings to political / economic rivalry to war. See Box 11.2 for three stories about struggles brought about by water shortages.
Box 11.2. How should we divvy up the water?
The problem of insufficient water supply is faced again and again around the world. And things will likely only get worse as populations grow. Stories of scarcity, unfulfilled demand, unpopular decision making by politicians, and unequal distribution are numerous enough to fill a large book, but we will briefly consider only three here.
1. Southern and Central California, USA: can agriculture, lawns, and drought all coexist?
The climate in these regions has been naturally dry for at least centuries, but matters have gotten progressively worse as a severe drought has persisted for most of the time between 1990 and the present day. The past decade or so has seen especially severe depletion of already limited water reservoirs, and no end appears to be in sight. It is worth noting that a relative lack of water only became particularly relevant after the number of people living in California grew dramatically to approximately 40 million during the past century. Prior to that time, the organisms living in the area were well adapted to the prevailing environmental conditions, and water-loving plants and animals were largely absent. Currently, local water supply is simply inadequate to meet local demands. So, what can be done? One strategy has been to impose dramatic restrictions on domestic use of water. Watering of lawns and washing of driveways are both prohibited on a state-wide level, for example. Programs to encourage replacement of inefficient fixtures have been initiated as well. These new laws are somewhat controversial, however, because analogous reductions have not been required of the agricultural sector, even though it uses far more water than does the domestic sector. Further aggravating matters, California enacted several programs—largely paid for with taxpayer dollars—during the past century to redistribute water from northern and eastern regions that enjoy a surplus to central and southern farming regions that are in a deficit. These and other reasons have enabled the state to become a major producer of fruits and other crops. Even rice, a plant that requires enormous amounts of water, is cultivated in desert-like climates in the state. Whether or not public funds should be used to support private agriculture, as well as the perception that the cost of the drought is not fairly borne by urban and rural water users, continues to be a major political problem[2].
2. Aral Sea, Central Asia: what happens when rivers are diverted?
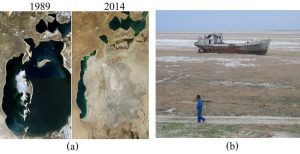
The Aral Sea was once an enormous inland freshwater lake, home to complex, rich ecosystems and a sizeable and successful fishing industry. Starting in about 1918, though, the then new Soviet government devised a plan to use water from two major rivers that fed the lake to irrigate cotton fields in other regions. Cotton production certainly increased as hoped, but the change in water distribution led to dramatic decreases in the amount of water in the Aral. The surface area of the lake decreased by approximately 50%, salt concentration increased until the water became like a typical ocean, most of the freshwater organisms disappeared, and the human residents in the area lost their livelihoods. Making matters worse, the drying water exposed the sandy bottom of the former lake, leading to toxic dust storms and increased prevalence of human diseases. Since the Soviet Union was very secretive during much of the 20th Century, outsiders had little knowledge of the gravity of the situation, and no external political pressure was applied to reverse the problem. Only after the opening and subsequent collapse of the USSR in the late 1980s was the full extent of the disaster revealed. Some attempts have been made to undo the damage, but only limited progress has been made (Figure 11.4)[3].
3. Would you fight for water?
Seemingly endless conflicts in and around the Middle East are obvious to almost anyone who pays even cursory attention to the news. What is less well known, though, is that a major cause of the fighting has been scarce water resources. The Arab-Israeli conflict is certainly rooted in religious and cultural differences as well as a long history of rivalries and disputes over land, but access to water is an additional source of tension. For example, control of the West Bank brings with it a good aquifer and some water security. Similarly, wars over the Golan Heights have, in part, been driven by aspirations to control the Jordan River. Relationships among Egypt, Sudan, Ethiopia, and Uganda also have been strained for many decades as these countries vie for access to the Nile River. Various agreements and treaties have helped, but war over the Nile’s water is hardly out of the question.
We use water we can access
Water is recycled by the natural processes of the hydrologic cycle. It is a finite resource, though, and time is required before water will return to any reservoir. As the number of people on Earth increases, it is becoming more and more difficult to meet daily demands for water and other limited resources (Chapter 8). Additionally, there is a non-uniform distribution of water. Even as various natural pathways move it around continuously, some areas always seem to have a relatively small amount of water relative to demand for it (e.g., much of China, the Middle East, northern Africa, the Southwestern United States), whereas others appear fortunate enough to have more than enough water (e.g., parts of Canada, the Northeastern United States, much of South America). Water stored both below and above ground is tapped to meet our demands.
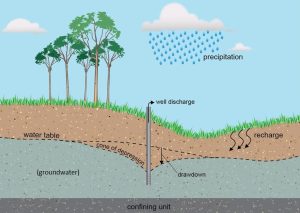
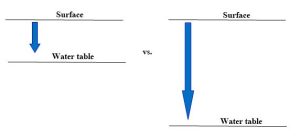
Groundwater reservoirs. As we saw in Chapter 4, this underground water is not readily accessible: wells must be constructed to bring it to the surface. The challenges do not end with just accessing the water, though. Aquifers, no matter how large, are finite. In the case of groundwater, overdraft occurs when withdrawal through wells removes water faster than infiltration can replace it. Chronic overdrafting in some areas has led to long-term lowering (called depression) of water tables and increased likelihood that wells will run dry. The resulting shape of the water table around a well (in 360º) is called a cone of depression, and the resulting depth to the water table is referred to as drawdown. These are important considerations because they affect well design. Keep in mind that an imbalance between rates of input (i.e., recharge) and output (i.e., pumping) could be caused by many factors, including natural phenomena like drought, as well as anthropogenic activities that place excessive demands on water. Figure 11.5 shows a model of an aquifer after pumping from it has begun (compare it to Figure 4.16).
Surface freshwater reservoirs. Rivers and lakes are often used as sources of water for agriculture, domestic use, and industry, particularly when groundwater is either limited or unavailable. As long as rates of water inputs to these reservoirs are equal to rates of outputs from these reservoirs, demand for water will be met. If water is removed faster than it is replaced, however, the reservoirs will become depleted, aquatic ecosystems will be damaged, and restrictions may be placed on the ways humans are allowed to use water. The water in surface reservoirs is also relatively vulnerable to pollution and must be cleaned sufficiently before it can be used (described later).
11.2 WATER POLLUTION
Clean water is indispensable to our survival, yet we have been using rivers, lakes, oceans, and other reservoirs as repositories for our unwanted waste for centuries. Why would we do this? The reasons broadly include ignorance, expedience, and convenience. History is filled with suffering brought about by seemingly illogical disregard for the importance of water, including the devastating outbreak of cholera described in Chapter 3 (Box 3.6). In that famous case, ignorance was largely to blame. But even now we try to justify water pollution with two, largely obsolete, reasons. First, reservoirs are viewed as infinitely capable of absorbing and diluting contaminants to concentrations too low to be of concern. The widely held belief captured in the phrase dilution is the solution to pollution was somewhat reasonable prior to the rapid growth of the human population during the past 100 years (Chapter 8) because the density of pollution sources was relatively low. Today, though, few bodies of water can absorb all the poisons people release. Second, since flowing water visibly carries toxic substances away, we can convince ourselves that the problem has been solved by dumping into a river. Appropriately summed up as out of sight, out of mind, this misconception often guides human responses to waste management, even if nearly everybody in the modern world is downstream of a pollution source sooner or later.
11.2.1. Sources of pollution
Water quality, essentially the suitability of a volume of water for its intended use, can be degraded by many human practices, including agriculture (Chapter 9), mining and power generation (Chapter 10), as well as gardening and other household activities, industry, healthcare, recreation (e.g., golf courses, other sports fields), and the military. Natural phenomena can also pollute water (more below). Their wide diversity has led to the creation of general classes of pollution sources based on some shared characteristics.
Point sources of pollution
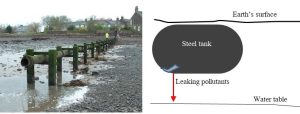
These are defined as discrete (i.e., singular or finite—not the same meaning as “discreet”) outlets from which pollutants enter a waterway. Point sources include pipes running from a factory or sewage treatment facility (more below) and leaking underground tanks that store fuels or solvents (Figure 11.6).
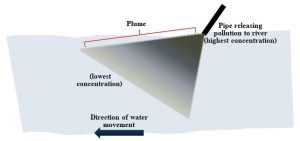
They release materials at relatively high concentration into water, and then those pollutants spread out away from their point of entry (i.e., as they move downstream) in what is known as a pollutant plume (Figure 11.7).
These types of sources are regulated, not prohibited, in the United States by both federal and local laws. For example, a National Pollutant Discharge Elimination System (NPDES) permit allows the release of certain materials into natural waters from point sources provided the guidelines regarding how much and how frequently waste is dumped are followed. Given the nature of point sources as singular outlets, regular monitoring of them can be readily accomplished—material flowing from a pipe, say, can be directly analyzed. Whether or not a given entity is complying with water quality laws is then assessed.
Non-point sources of pollution (NPS)
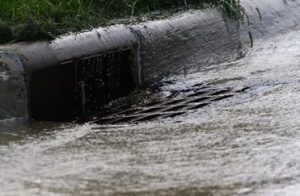
These are diffuse and non-discrete outlets. From a legal standpoint, they are simply defined as anything that is not a point source. Rather than flowing out of a single pipe or other structure, pollutants originate from numerous and hard-to-quantify sources such as agricultural fields, cities, and suburban developments. Recall that some fraction of the precipitation striking the Earth moves as runoff (Chapter 4). When this water flows across land that has been contaminated with pesticides or fertilizers (Chapter 9), buried garbage (Chapter 13), motor vehicle fluids from urban areas, or household chemicals and lawn fertilizers from neighborhoods, it can pick up some of those pollutants and carry them downhill to both above- and, potentially, below-ground reservoirs (Figure 11.8).
Sometimes overlooked is the way combustion contributes to non-point-source pollution. The burning of fuels, garbage, and other materials can produce air pollution, some of which mixes with water in the atmosphere and falls to the surface with precipitation. Since runoff can travel some distance before it intersects with a body of water, it has the potential to encounter a diversity of pollutants from many different sources as it moves. Although it is possible to analyze the composition of a natural body of water, it is exceedingly difficult to identify non-point sources of any unwanted compounds found in it. We could, for example, quantify the amount of a certain pesticide (Chapter 9) present in a hypothetical river, but we would have no simple way to determine which of the six farms in a 1000-acre upstream area is most responsible for releasing it. Similarly, water on city streets can carry gasoline and radiator fluid into storm drains, and subsequently to a river or ocean, but it would be nearly impossible to ascertain which of the 2,000,000 cars driving around that area are actually leaking those pollutants (see Figure 11.9 for a diagram of non-point sources of pollution).
In short, regulation of water pollution is far more complex for non-point than for point sources. Education of polluters, economic incentives, and other means are generally employed about as often as is enforcement. In addition, the kinds of chemicals available for use, such as which pesticides farmers are allowed to purchase, can help control NPS pollution. Perhaps the most notable instance of this approach was seen in 1972 when DDT, a widely used insecticide (Chapter 1), was banned for sale in the United States. That step had a profound effect on environmental systems, as we will see in Chapter 15.
Non-human sources
Natural sources are important sources of harmful substances. For example, particles launched into the atmosphere by volcanic eruptions and spray caused by precipitation striking surfaces of soil and rocks can be deposited into waterways. Additionally, as water infiltrates soil, it can dislodge metals and other natural toxins and carry them downward toward the groundwater reservoir. Note that source of pollution does not affect the regulation of water quality: to be fit for a particular use such as drinking, water must still meet the standards for biological, chemical, and physical contaminants (next section).
11.2.2. Types of pollutants
A great diversity of biological, chemical, and physical agents can degrade water quality. In response, the United States Environmental Protection Agency (EPA) maintains a list of approximately 100 regulated substances, those for which maximum allowable limits in drinking water have been established (varying approaches are used around the world). As we will see below, these are broadly grouped as biological, chemical, or physical pollutants. You should realize that the EPA also tracks many other materials not on the list that are suspected to pose risk but for which legal standards have not been established. Water intended for uses other than human consumption is subject to similar kinds of regulation (see Box 11.3 for a brief discussion of this topic).
Box 11.3. A sliding scale for contamination
How do we determine if water is safe? The answer depends on what we intend to do with that water. Consider that streams, swimming pools, car washes, and other settings will be held to lower standards than water slated for domestic use. The number and diversity of potential pollutants and their allowable levels is enormously high: metals, pesticides, organisms, and physical materials are all of concern. In any case, you should realize that for many reasons it is next to impossible to purify water. Even drinking water has some low levels of toxins present in it.
Biological agents
Unless it has been sterilized by boiling or other means, water will contain some number of live microbes in it. For the most part, these organisms are not harmful. However, some bacteria, protozoa, and viruses cause diseases, and their presence in drinking water is concerning. A small sampling of illnesses that can be transmitted through polluted water includes dysentery, cholera, polio, and hepatitis. In the U.S., federal and local laws provide strict guidelines governing the numbers of pathogens allowable in drinking water because of the potential threat they pose to human health.
Chemical agents
Many chemical compounds are of concern to environmental scientists and governmental regulators. A list of potential contaminants includes pesticides and fertilizers, solvents, fuels, cleaning agents, drugs, and metals. These compounds come from a variety of sources and can bring about adverse effects to human and environmental health. Note that, although it is not always viewed as toxic, various types of salt can also cause serious water pollution issues (more below).
Physical agents
Some pollutants are best described as physical entities because they are not living, and the threat they pose is not necessarily linked to their chemical properties. For example, floating trash, sediments, and other agents that are not dissolved in water are categorized here. They are problematic for several reasons, including their ability to block sunlight, directly damage sensitive organisms, and render drinking water unpalatable (and possibly toxic).
11.2.3. Surface water pollution
Rivers, lakes, and oceans are particularly vulnerable to contamination because they tend to have large, unprotected surfaces; pollutants carried in precipitation and runoff (Chapter 4) can flow into them freely. Salts also can accumulate in these bodies due to several processes. Such reservoirs can only be used as intended if the pollutants in them are removed, a task that can be very difficult to carry out (see the section near the end of this chapter for more about strategies used to clean up contaminated surface water).
11.2.4. Groundwater pollution
Leaching from the surface
If you recall that approximately 98% of Earth’s fresh, unfrozen water is found beneath the surface (Chapter 4), it should be clear why pollution of this reservoir is of great concern to environmental scientists. Like the surface waterways described in the previous paragraph, groundwater can be contaminated from many sources. However, unlike rivers, lakes, and oceans, it is somewhat less vulnerable because of its position underground. Anything released at the surface must travel vertically downward with flowing water (i.e., infiltration), a process known as leaching, through the unsaturated zone before it can reach the saturated zone (Chapter 4). During leaching, a pollutant may undergo chemical changes that render it non-toxic (degradation) (more in Chapter 15), or it could interact with the soil and other materials through which it moves in such a way that it is slowed or even stopped before it travels very far. A number of factors influence the extent to which materials are able to reach the water table. Depth is the first important consideration. As a rule, shallow groundwater is more likely to be polluted than is deep because there is less time to remove or alter the chemical before it gets to the saturated zone (Figure 11.10).
Secondly, environmental properties can control the success or failure of microorganisms living in soil that might be able to decompose some pollutants. If conditions are too harsh to allow their growth, bacteria that might be capable of eating a pollutant in principle will not be able to actually do so in practice. Furthermore, given their different properties, soils vary in their capacity to bind and slow compounds flowing in water. A final variable is related to the chemical properties of the pollutant in question. Simply put, some compounds are intrinsically difficult to break down, whereas others are unstable and can be degraded easily.
Saltwater intrusion
An aquifer near a body of saltwater, such as one in a coastal region, can become contaminated if wells constructed in it withdraw water faster from the saturated zone than can be replaced by recharge (i.e., overdraft). In this case, salty water below the bottom of the ocean is drawn through the subsurface into the zone that was solely occupied by freshwater before the presence of wells (Fig. 11.11).
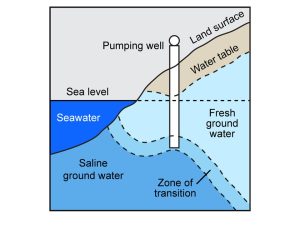
Saltwater intrusion often renders an aquifer unfit to meet demand and necessitates the importation of water from an external source. For example, a network of aqueducts carries water as much as 200 km from places like the Catskill Mountains in New York State (U.S.A.) to New York City in response to saltwater intrusion and other problems with the water near the city. We will see more about salt pollution near the end of this chapter.
11.2.5. Humans can reduce the amount of pollutants in waterways
Speaking broadly, the amount of waste in natural systems, including reservoirs of the hydrologic cycle, can be minimized in two ways: control of releases before they occur, and clean up, known as remediation, of contaminated systems after pollutants have entered them. Although prevention is often less costly than remediation in the long run, it is not always possible to be proactive. Many problems were created years ago, so clean-up is the only option available to us.
Wastewater management: an overview
Industry, agriculture, healthcare, and sewage are among the sources of what is generally known as wastewater, that is, water-based outputs containing potentially harmful products. In simple terms, we clean, or treat, wastewater to remove materials that render water unfit for whatever use we intend for it (review Box 11.3). Here we will explore sewage treatment, just one example of this type of remediation.
Sewage treatment
Human sewage is not the topic of conversation at many dinner parties. It is probably fair to say that few people ponder, or frankly even wish to ponder, what happens to the water they flush down a toilet or drain from a shower. Like it or not, though, the excrement and other waste generated by each of us contributes to a continuous and enormous problem that must be addressed if we want our water to be safe for the various demands we place on it: consider that about 360 billion cubic meters (95,000 billion gallons) of wastewater is produced worldwide each year[4]. It varies by country, as you likely expect, but it is safe to ay that those toilets never stop flushing! Additionally, clean-up is enormously challenging because sewage contains so many kinds of pollutants. Multiple items from each of the three categories we established earlier—biological, chemical, and physical—are present and pose substantial risks to water quality. The list of materials that worry us includes far more than human feces and urine. Paper, drugs, plastic, latex, cleaning products, cotton swabs, pets, and anything else a person might flush down a toilet must be removed from the water. Even currency and other valuables occasionally end up in the waste stream (a $20 bill found by a sewage plant worker is still worth the same as one in your wallet, although clearly neither is fit to be put into your mouth). See Table 11.1 for a list of some of the most important contaminants found in sewage along with example adverse effects caused by them.
Table 11.1. Example water pollutants and their potential adverse effects.[5]
|
Contaminant |
Category |
Example adverse effects |
|---|---|---|
|
Microbial pathogens (Ch. 3) |
Biological |
Dysentery, cholera, typhoid fever, hepatitis, polio, meningitis, giardiasis |
|
Pathogenic worms |
Biological |
Diarrhea, malnutrition |
|
Antibiotics |
Chemical (drugs) |
Antibiotic-resistant bacteria (Ch. 3) |
|
Hormones, steroids |
Chemical (drugs) |
Disruption of animal reproduction, possible human growth effects |
|
Pesticides (Ch. 9) |
Chemical (agriculture) |
Cancer, reproductive effects |
|
Fertilizers (Ch. 9) |
Chemical (agriculture) |
Oxygen deprivation to the brain |
|
Cleaners, soaps, shampoos |
Chemical (domestic) |
Damage to ecosystems |
|
Metals |
Chemical (industry) |
Birth defects, cognitive deficits |
|
Solvents, fuels |
Chemical (industry, transportation) |
Cancer, respiratory damage |
|
Sediment |
Physical |
Limits on primary production (Ch.4) |
|
Paper, plastic, Styrofoam, wood |
Physical |
Various disruptions to ecosystems |
Given this complex composition, it is impossible for just one strategy or method to remove all the pollutants of concern; many steps are typically required to clean sewage. In addition, not all homes, neighborhoods, and cities use the same approach to sewage treatment. Put succinctly, it is a very complicated and extremely important environmental problem. Three methods commonly used in the United States are summarized here.
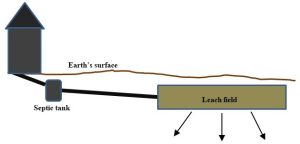
Backyard septic systems. Homes in areas that are relatively sparsely populated tend to employ this strategy to treat sewage (wastewater from roughly 20% of homes in the United States is treated via septic systems[6]). Waste travels from a house to a small, buried septic tank (dimensions on the order of a couple meters) where it is held long enough for large objects to sink while liquids rise. Some of the solids are partially digested by microorganisms that are adapted to eat such things, but some are stored and must be pumped out periodically. The contaminated liquid is slowly released from the tank into a drain or leach field, a flat underground pit filled with gravel, soil, and other porous materials. Here solids are physically separated from the flowing water, and additional microbial activity breaks down more of the digestible waste products. Figure 11.12 provides an idealized diagram of a typical septic system.
Note that these localized treatment facilities must be carefully designed and installed to ensure that surface and underground water reservoirs are not contaminated and that toxins do not come into contact with humans or other organisms. Among many considerations, sufficient space must be available to make them work as intended. In urban and other densely populated areas, septic systems are inadequate to safely treat sewage, so one of following two strategies must be employed instead.
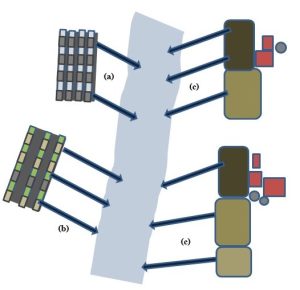
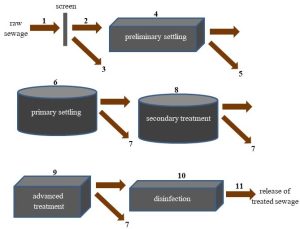
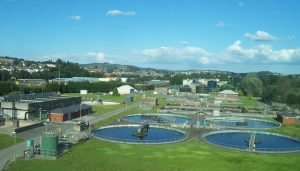
Municipal sewage treatment plants. Where small, individual septic tanks are impractical due to population density, such as in a city, sewage is collected from homes and sent via sewer pipes to a centralized sewage treatment plant. This is the strategy used by about 80% of U.S. homes to manage 34 billion gallons (approximately 129 billion liters) of sewage water every day[7]. The specific details of how wastewater is treated vary from place to place, but these facilities tend broadly to use the same strategy. Generally, the mixture of materials described above goes through multiple steps to remove harmful materials and yield water clean enough to be released into a natural reservoir (see Figures 11.14 and 11.15, located below the descriptions of the many steps, for a diagram and a photo of a sewage treatment plant).
1. Preliminary treatment
The first step at a municipal plant is to remove large, solid materials by passing raw sewage through a screen. The result is an eclectic mound of trash that is usually dried and buried in a landfill (Chapter 13). The water that has been separated from the trash passes to the next stage. Gravel and other solids also may be removed.
2. Primary treatment
The goal of this step is like that of the screening step: further separation of solids from liquids. Liquid passing preliminary treatment is collected in settling tanks where heavy materials sink and liquids rise to the top. These tanks are large, at least 15 meters wide and 2 meters deep, and accomplish what occurs in the smaller septic tanks described above. The resulting liquid is still not ready to be released into a natural waterway, but it is much clearer than the initial sewage. It is sent on to the next step of treatment, described below. Some of the solids are inorganic grit, like gravel, and cannot be further altered. Many of the solids are organic, though, and are collected in tanks where anaerobic microorganisms can partially break them down. The gaseous products of this digestion, known as biogas, can be collected, processed into methane, and burned to generate electricity (Chapter 10). The undigested solid products may be dried and applied as fertilizer to farmlands (Chapter 9).
3. Secondary treatment
The water left after primary treatment is put into contact with specialized bacteria capable of digesting many of the materials still present. As a result, a substantial reduction in the amount of organic pollutants present in the sewage is accomplished. Lower levels of organic compounds decrease demand for oxygen by aerobic microorganisms in the water because their food source has diminished in size. The logic may seem a little convoluted, but less food in the water means less demand for dioxygen and therefore higher amounts of dissolved O2 remaining in the water. The effectiveness of secondary treatment can be assessed through the measurement of a critical property known as biochemical oxygen demand (BOD); if BOD is too high, the water is deemed to be polluted.
The now-cleaner liquid moves on to additional treatment (step 4, below, may occur, or the liquid will move directly to step 5), and the solids generated in this step (dead microbial cells, for example) are sent to the same tanks used to digest the materials left after primary treatment (step 2, above). Secondary treatment is only as effective as the bacteria responsible for it, so a great deal of effort is exerted to maintain optimal environmental conditions for these organisms to grow and thrive.
4. Advanced treatment
Additional processing may, in rare cases, target remaining pollutants. The need for these steps varies from place to place, but generally they are designed to remove problematic nitrogen-containing compounds (Chapter 4), pesticides (Chapter 9), or other pollutants present in unacceptably high concentrations.
5. Disinfection
The number of disease-causing microorganisms present in the sewage is reduced through one of several specific mechanisms. Chlorination of the water is the most commonly employed technique because it is typically the least expensive option and it effectively destroys many bacteria. There are some disadvantages, though, including the facts that some important pathogenic protozoa are resistant to chlorine compounds, and remaining chlorine can lead to the production of potentially harmful compounds. Ozone gas (Chapter 14) or ultraviolet light can be used instead of chlorine, but they have limitations as well. By whatever method, though, disinfection is critical to reducing the risk of water-borne diseases.
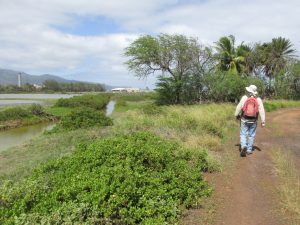
6. Release of treated water
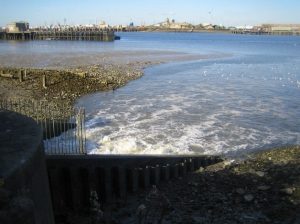
Finally, the treated water can be returned to a natural reservoir through a pipe, known as the sewage outfall, that exits the facility (see Figure 11.13).
This released liquid, known as effluent, is tested periodically to be sure it meets the requirements for levels of physical, chemical, and biological pollutants. Intended use will of course dictate just how strict the standards will be. Effluent released into a stream must be clean enough for swimming and fishing; notably, BOD must be low enough to ensure that fish and other aerobic organisms will have sufficient oxygen to survive. In some cases, inadequately treated sewage containing excess amounts of digestible organic material (and therefore high demand for oxygen by aerobic microorganisms) has led to fish kills in receiving waterways. Note that water destined for human consumption must pass through a separate drinking water treatment plant, where additional settling, filtration, and chemical additions can be used to make it potable.
Before moving forward, we should note that public facilities generally are effective in the removal of physical pollutants (steps 1 and 2, above), reduction of BOD (step 3), and killing of most pathogenic bacteria (step 5). Typically, though, wastewater treatment plants have little or no capacity to break down or remove industrial chemicals. Instead, problematic compounds are treated, by law, prior to their release into public sewage. The specifics of such Industrial Pre-treatment Programs (IPTP) vary and depend on the nature of the chemicals of concern. Broadly, commercial entities that produce toxic waste products must follow permitting rules established by the United States Environmental Protection Agency before releasing such chemicals into municipal waste streams.[8].
Other approaches. Septic systems and municipal facilities dominate sewage treatment in the United States. However, other options are used in a small number of cases. A constructed wetland is one example of a system that can accomplish many of the same goals as conventional treatment (Figure 11.16).
Human waste can be piped to a relatively large and open area that has been modified to resemble, at least superficially, a swamp. Through the action of their grasses, sediments, and microorganisms, these artificial ecosystems can filter and retain toxic substances as well as facilitate decomposition of organic materials. Constructed wetlands are by no means equivalent to natural wetlands, but they offer an alternative strategy to wastewater management. Smaller-scale experimental systems that clean wastewater from a single building by using aquatic plants have been developed as well, although they too are rare.
Salt removal
Earlier in this chapter we saw that salts can accumulate in water and render it unfit for its intended use. Drinking water standards are particularly rigorous, and even a small amount of dissolved salt can leave the affected water unpotable. What might seem like a minor problem is actually quite troublesome: consumption of excessive amounts of saltwater can be deadly to humans. Additionally, as freshwater shortages become increasingly common in modern times, more and more people look to the world’s oceans for suitable drinking water. The obvious question is: can this water be made safe to consume? Although the answer is yes, the problem is not as straightforward as we might hope. Desalination, or the removal of salt from water, can be readily accomplished through a process such as distillation or reverse osmosis, but a large amount of energy (and, therefore, money) is required to do it on a large enough scale to be relevant for communities of people. Some wealthy nations with no other realistic options invest enormous amounts of money in desalination, but it is generally not their first choice.
11.3 EXTENDING OUR SUPPLY OF USEABLE WATER
To end our discussion of water, we will briefly consider some of the ways people can reduce usage, conserve water, and increase availability of freshwater to help meet both present-day and future demand.
11.3.1. Improve efficiency
All three sectors can take steps to reduce the amount of water they use without compromising the integrity of the activities they perform. Since it is the biggest user of water, increased efficiency in agriculture can have a substantial impact. More careful and targeted irrigation as well as cultivation of crops in appropriate climates are among the many strategies farmers can employ to bring about savings. Industry can use less water through better management of processes as well as recycling of water in various ways. Usage by the domestic sector can be reduced by switching to bathroom fixtures, laundry machines, dishwashers, and other appliances that require low amounts of water to operate. Changes to simple habits associated with faucet use (e.g., do not leave them running unless absolutely needed) can also conserve water. Toilet design is but one example worth some consideration. Noting that flushing required far more water than was usually required, the United States Federal Government created new efficiency standards as part of the Energy Policy Act (1992). In short, household toilets were limited to 6 liters (1.6 gallons) per flush, less than half of the volume used prior to that new law[9]. Despite some early opposition to the regulations, as well as some (perhaps predictable) technological challenges, these new toilets have been in use for much of the past three decades. More efficient fixtures are available, including some no-water toilets, but they are not mandated by federal law. Remember, though, that since it uses far less water than the other two sectors, only modest overall savings can be realized though reductions in household use.
11.3.2. Raise the price of water
Many people concerned about water conservation argue that the cost of water is simply too low to effectively discourage wasteful use. According to a report published by the United States Environmental Protection Agency, water is cheaper in the U.S. than it is in other industrialized countries, giving the inaccurate impression that water is more abundant than it really is. You are encouraged to consult the EPA website[10] for more information.
THE CHAPTER ESSENCE IN BRIEF [11]
Multiple and varied human demands affect the availability of clean, fresh water; as the human population grows, scarcity of this crucial limited resource will only increase. Strategies to protect our water supply include restrictions on usage and releases of pollutants, as well as treatment of wastewater.
Think about it some more…[12]
How can some types of water usage be considered consumptive if Earth is closed with respect to materials?
Why are environmental scientists concerned about water supply and quality on a planet that has such abundant water?
In your view, which sectors should be given priority access to limited freshwater supplies?
Is dilution ever a solution to pollution?
What about the content of sewage makes it particularly difficult to treat?
If it were up to you, what measures would you put in place to extend our supply of freshwater?
- US Geological Survey. 2019. Total Water Use. https://www.usgs.gov/mission-areas/water-resources/science/total-water-use?qt-science_center_objects=0#qt-science_center_objects ↵
- ca.gov and nytimes.com, Your contribution to the California drought, Larry Buchanan Josh Keller, Haeyoun Park ↵
- NASA. Earth Observatory. earthobservatory.nasa.gov/world-of-change/AralSea ↵
- United Nations University. Institute for Water, Environment, and Health. 2019. https://inweh.unu.edu/half-of-global-wastewater-treated-rates-in-developing-countries-still-lagging/#:~:text=%E2%80%9CGlobally%2C%20about%20359%20billion%20cubic,water%20is%20currently%20released%20untreated. ↵
- Most of this information comes from US Environmental Protection Agency. 2009, accessed 2023. National Primary Drinking Water Regulations. epa.gov ↵
- U.S. Environmental Protection Agency. 2023. The Sources and Solutions: Wastewater. https://www.epa.gov/nutrientpollution/sources-and-solutions-wastewater ↵
- U.S. Environmental Protection Agency. 2023. The Sources and Solutions: Wastewater. https://www.epa.gov/nutrientpollution/sources-and-solutions-wastewater ↵
- Readers interested in learning more about IPTP are encouraged to consult https://www.epa.gov/npdes/pretreatment-standards-and-requirements-applicability ↵
- US Environmental Protection Agency (EPA). 2017. Water Efficiency Management Guide Bathroom Suite. EPA 832-F-17-016d. epa.gov ↵
- US EPA. 2017. Pricing and Affordability of Water Services. https://www.epa.gov/sustainable-water-infrastructure/pricing-and-affordability-water NOTE: Various states have enacted similar measures that include higher pricing to encourage conservation by consumers. ↵
- As you will find throughout this book, here is very succinct summary of the major themes and conclusions of Chapter 11 distilled down to a few sentences and fit to be printed on a t-shirt or posted to social media. ↵
- These questions should not be viewed as an exhaustive review of this chapter; rather, they are intended to provide a starting point for you to contemplate and synthesize some important ideas you have learned so far. ↵
In ecology, all of the living and non-living entities present in a defined space. See Chapter 5 for more.
An adjective referring to an organism that uses dioxygen in its metabolism. "Aerobe" is the noun, the organism itself. Contrast with anaerobic. See Chapter 1 for more.
A process whereby a relatively clear aquatic system is transformed to first a murky then swampy then, potentially, a dry terrestrial system. It is caused by the accumulation of excess nutrients (nitrogen and/or phosphorus). See Chapters 4 and 11 for details.
In ecology, refers to the specific identity of organisms present in an ecosystem. This property varies widely among ecosystems. See Chapter 5 for details.
In the context of environmental science, refers to a major group of activities that are related to each other. Important sectors are industrial, agricultural, and domestic. For example, we can speak of water use by sector (as in Chapters 9 and 11).
Refers to replacement of water in the groundwater reservoir. Recharge is largely the result of precipitation followed by infiltration of water downward. Melting snow and ice at the surface can also contribute. See Chapter 4 for more.
Discrete outlets that release contaminants into water reservoirs. For example, a pipe that drains from an industrial site is a point source of pollution. These are relatively easy to identify and remediate; compare to non-point sources of pollution. See Chapter 11 for more.
Refers to the many different kinds of microscopic organisms that are single celled and prokaryotic (i.e., do not possess distinct cellular organelles). Collectively, bacteria are extremely diverse, are the oldest organisms on Earth, and are critical to many environmental cycles and processes. See Chapter 3 for more.
A group of organisms that are microscopic, eukaryotic, mobile (also known as "motile"), and usually heterotrophic. They are roughly ten times larger than bacteria; they also tend to prey on bacteria. See Chapter 3 for more.
An acellular biological entity. Viruses are not alive in the same sense that cellular plants, animals, fungi, bacteria, and protozoa are alive, but they carry genetic information and can reproduce using the machinery of cells in organism they invade. Viruses are extremely small, 100-1000 times smaller than most bacteria and 1000-10,000 times smaller than most eukaryotic cells. They are important agents of disease. See Chapter 3 for more.
A general term that refers to the breakdown of a relatively large, complex compound into smaller, simpler products. It involves the breaking of chemical bonds by biological or non-biological means. See Chapter 15 for details.
Refers to organisms that are too small to be seen without the aid of some kind of magnifying lens (e.g., a microscope). Includes bacteria, protozoa, certain forms of algae and fungi, and viruses. See Chapters 1 and 5 for more.
A general word that refers to the breaking down of relatively large, complex materials into relatively small, simple materials. Certain organisms, known as decomposers, break down the remains and waste products of other organisms and use those products as nutrient sources. Decomposers are critical to the health of ecosystems because they aid in the recycling of materials. Fungi and some bacteria are important decomposers. See Chapters 4 and 5 for more.
In chemistry, refers to chemical compounds that lack at least one of the following: a C atom and at one C-H bond. Compare to organic. See Chapter 4 for details.
In chemistry, an adjective that refers to chemical compounds that consist of at least one C atom that is bonded to at least one H atom. Compare to inorganic. See Chapter 4 for details.
An adjective referring to organisms that do not use dioxygen as part of their metabolism. Many such organisms die in the presence of oxygen gas. "Anaerobe" is the noun. Compare to aerobic. See Chapter 1 for more.
An important water quality parameter. In simple terms, BOD is a measurement of the amount of aerobic metabolism occurring in a water sample, that is, the level of decomposition of organic materials by microorganisms. High BOD will drive down levels of dissolved oxygen in the water and, in some cases, lead to the deaths of fish and other aerobic animals. BOD can be thought of as an indirect way to measure water quality: when there is a lot of organic matter in the water, a lot of oxygen will be required by decomposing organisms to digest that organic matter. See Chapter 11 for more.
A general term that includes any disease-causing organism. Some bacteria, fungi, protozoa, and algae are on this list, as are many viruses. Certain worms and other larger organisms can act as pathogens as well. See Chapters 3 and 5 for more.
Non-potable water is not safe for human consumption (opposite: 'potable water'). See Chapter 11 for more.
