A Woman’s Place is on the Political Spectrum
Rachel Szachara
Following the 2018 elections, more women were sworn into office than ever before. Though the long-lasting results of and the reasons for the high success rate of women in 2018 remain unidentifiable to a degree of certainty, there are many factors that may allow for a greater understanding of the meaning behind this election cycle. This paper will focus on examining ideology. Specifically, the ideologies of newly elected representatives and how the gender of these elected officials plays a role in the ideology of Congress as a whole. My study focuses on the ideological diversity of the House of Representatives, which should be understood as the range between the most conservative representative and the most liberal representative. If there is a greater range between these two representatives, there is a greater amount of ideological diversity in that Congress. This paper seeks to answer the question of how has the ideological diversity of the Democratic party changed over time, and if the Democratic women elected in 2018 have different ideological placements than the Democratic men elected in 2018.
Previous Ideology Scholarship
Ideological Diversity in Congress
The United States Congress is a two-party institution with members identifying across the ideological spectrum. However, the ideologies of Congress have been becoming increasingly polarized over time and, as of 2014, it was the most ideologically polarized out of any Congress in history (Hare and Poole 2014). Leading up to the 2018 midterms, the 2016 elections are often cited as being the most extreme case of electoral polarization the United States has seen due to the nature of candidates running and their highly negative profiles in media coverage (Murphy 2016; Soergel 2016; Boxell et. al 2017). Polarization, such as has been noted in Congress, can usually be attributed to one of two main causes: adaptation – where current Congress member’s ideology shifts – or replacement – where new Congress members are elected with more polarizing ideologies (Theriault 2006). While both help explain the polarization of Congress, replacement theory wins in the end, causing approximately two-thirds of the shift towards greater polarization (Theriault 2006). The very dimensions of this polarization have also increased in recent years, as the scope of issues Congress deals with has widened on both ends (Hare and Poole 2014). The idea that Democrats have become more likely to elect strong liberals while Republicans have become more likely to elect strong conservatives has led to a decline in moderate candidates running and winning elections (Hare and Poole 2014; Theriault 2006; Jochim and Jones 2012; Thomsen 2010). This, in turn, perpetuates the cycle of Congress becoming increasingly polarized.
One of the main factors leading to moderates being less likely to run and win is attributed to the theory, established by Thomsen (2010), that candidates are most likely to run if they feel their personal ideology aligns with the current state of the political party that they are running within. As parties appear to become increasingly liberal or conservative, they actually become this way due to the effect their perception has on potential future candidates (Thomsen 2010). Thus, it can be theorized that, as the Democratic party appeared to become more ideologically diverse post the 2016 election (Murphy 2016), more ideologically diverse candidates were likely to run for the Democratic party in 2018. Further, it has been found that voters, similarly to candidates, also have a desire to align more closely with the ideology of one of the parties (Jochim and Jones 2012). This alters the way these citizens vote, making these more hypothetical ideologically polarized candidates not only more likely to run but more likely to win.
The Democratic party is currently more ideologically diverse and less ideologically cohesive when compared to the contemporary Republican party (Grossman and Hopkins 2016; Graham 2018; Judis 2011). This, in tandem with the nation as a whole becoming more polarized and further away from the center, may lead to a more polarized Congress, with some moderate representatives, but potentially more polarized representatives as well. (Hare and Poole 2014). Party affiliation and ideology, however, are not the same and must be understood as linked yet separate. Though the Democratic party tends to align with liberal issues, representatives in the Democratic party can be considered conservatives or agree with conservative perspectives on certain issues. My question then turns to how this relationship between ideology and partisanship unfolded in the 2018 elections, and subsequently how it is unfolding in the 116th House of Representatives, compared with previous Congresses. The significant impact of the record number of women running for and winning office in 2018 cannot be ignored (Collins and Lu 2018), forcing the question of what role does gender play with ideology?
Gender and Ideology
The role that gender plays in shaping ideology and impacting votes is difficult to fully unpack and concretely define. Gender gaps in voters exist, where men are more likely to be more conservative and women are more likely to be more liberal (Gillion et. al 2013; Coffé 2013; Kaufmann 2002; Norrander and Wilcox 2008; Pratto et. al 1997). The gender gap of voters first emerged in the 1970s and is due to the idea that highly educated women realized that their more liberal views could translate to becoming self-identified Democrats (Gillion et. al 2013). This gender gap still exists today and was relevant in the 2018 elections as sixty percent of women voted Democrat whereas forty-seven percent of men voted Democrat (Schaffner 2018). Republican women, as found by Thomsen (2015), are more likely to be more moderate (i.e. less conservative) than their male counterparts. Therefore, liberal women are taken more seriously as candidates when running in the Democratic party because they fit the lean of the party ideology (Thomsen 2015). This partially begins to explain why Democratic women are more likely to run than Republican women.
One notion commonly attributed to the gender gap is that men are more politically engaged, interested, and knowledgeable than women (Coffé 2013). However, recent literature has begun to push back against this idea and attributes the gender gap to other factors, such as that women are simply interested in different issues than men, with women more interested in local politics and issues that impact them more directly, such as healthcare (Coffé 2013). Kaufmann (2002) finds that women tend to be impacted by particular cultural issues more than men. Partisan alignments for men tend not to be due to their opinions on cultural issues. Women, on the other hand, are much more likely to become more liberal and identify as Democrats due to the party’s cultural liberalism and the importance of these issues to women (Kaufmann 2002). Redman (2016) finds that increasing liberal values, particularly feminist values, makes any democratic candidate perform better. Specifically, though, this increases the ratings of Democratic women candidates the most, causing him to conclude that identity plays a large role in representation (Redman 2016). The 2018 midterm elections included many candidates running on identity politics, particularly within the Democratic party, which embraced diverse candidates that back diverse, progressive policies (Scott 2018). If what Redman argues is true, this could have led to an increased number of diverse, progressive candidates, including more liberal and feminist women, winning office. It has also been noted that women generally favor more leftist government, are less focused on social dominance, and are less in support of group inequality than men (Pratto et. al 1997).
It is still up for debate how much gender truly impacts ideology and if gender is salient enough to transcend party identification. One study by Olson and O’Loughlin (2009) suggests that women in Congress behave differently on the floor than men in Congress, generally acting more liberal, suggesting that gender is a significant influence for policy preference. However, they also conclude that party is likely restrictive on the formation of one’s ideology based on their gender. This is specifically true for Democrats, showing that the influence of the desire to promote group cohesiveness weighs heavily particularly on female Democrats (Olson and O’Loughlin 2009). Conversely, Lizotte (2017) finds that gender is in fact salient enough to transcend party identification. Her study concludes with the finding that women, regardless of party are more likely to support an activist government. Republican women are more likely than Republican men to support more activist governments and same goes for Democratic women (Lizotte 2017). When looking at voters, there also appears to be a significant difference in the issues women find important compared to men. Culture issues such as healthcare, gender inequality, and race relations, show a statistically significant difference in how important they are to female voters compared to male voters (Deckman 2018). According to this literature, women tend to be politically motivated by culture issues more than men, with their ideological placement leaning more towards liberal. My study hopes to address the question of if the Democratic women elected in 2018 have different ideological placements than the Democratic men elected in 2018.
Methodology for Measuring Ideology
Ideology, by nature, is a difficult concept to measure, particularly numerically. The method introduced by Poole and Rosenthal in 1997 has become the industry standard for measuring the ideology of legislators. Their method, entitled NOMINATE, which stands for Nominal Three-Step Estimation, relies on the Median Voter Theory, and assumes that each legislator will vote according to which side of the roll call midpoint they are on. NOMINATE also works with assumptions that all choices can be seen in a low-dimensional space and that all individuals have an ideal point within this space, which comes to maximum peak at their desired outcome. This is the outcome that Poole and Rosenthal predict the legislator would then vote for. Using this formula, they then place each legislator on a scale from –1, being the most liberal, to 1, being the most conservative (Poole and Rosenthal 1997).
The NOMINATE method has been highly contested, with many other methods being introduced as alternatives. One method utilizes governors’ State of the State addresses to code language as liberal or conservative (Coffey 2005). Another method surveys past legislators in order to determine what one’s self-identified ideology is (Griffin 2008). A study by Barry Burden, Gregory Caldeira, and Tim Groseclose compared nine different ideological measuring methods in order to determine which is the most effective. These methods included five which relied on roll call, including Poole and Rosenthal’s standard NOMINATE method and constituent descriptions of their legislator’s ideology, legislator’s self-identification, identification by magazine editors, and content analysis of newspaper stories. The study concluded that they could not locate a method that work better, in total, than the original method of using roll call votes (Burden et. al 2000). I will use the NOMINATE method to measure ideology in my study.
Measuring Ideology of Then and Now
To attempt to answer my research question, I found ideological scores for all the freshman Democrats elected to the House of Representatives for the elections of 2018, 2016, 2014, 2012, 2010, 2008, 2006, 2004, 2002, 2000, 1998, 1996, 1994, and 1992. I did not include the scores of incumbents in order to measure how ideological diversity of the party changed over time. I am most interested in where the party is going in the future and how new members are shaping ideology, and less interested in how current political climates alter NOMINATE scores of incumbents. I also did not want to include a representative’s ideological score in multiple years, though it is likely to have changed from year to year, as I thought it could make the results more difficult to interpret. In order to do this, I used the online tool from Vote View, which relies on the NOMINATE method created by Poole and Rosenthal to assign each representative an ideology score from –1 (most liberal) to 1 (most conservative). I rounded each score to the nearest twentieth and then measured the frequency of scores for Democratic men and women for the 103rd – 116th House of Representatives. I also measured the mean scores of the newly elected Democrats to each House by gender and how it changed over time. Finally, I measured the range of NOMINATE scores for newly elected Democratic men, women, and the Democratic party in general for each House.
In order to control for party differences, I studied only the Democratic party. The Democratic party over the Republican party is currently more ideologically diverse (Grossman and Hopkins 2016; Graham 2018; Judis 2011) and Democrats nominate and elect more women into Congress than Republicans (Bacon, 2018). Further, women are more likely to be more liberal than conservative, which lends itself best to studying the Democratic party (Gillion et. al 2013; Coffé 2013; Kaufmann 2002; Norrander and Wilcox 2008; Pratto et. al 1997). The 2018 elections were significant to the Democratic party because of the abnormally high number of women elected and because the Democrats won the House of Representatives, making Democratic women in the House an interesting group to consider.
Comparing NOMINATE-Score Graphs
Figure 1 shows the mean NOMINATE scores of the new Democratic members of each Congress from the 103rd House, elected in 1992, to the 116th House, elected in 2018, with the scores separated by gender. For the most part until the 113th House, the ideologies of men and women moved in a similar pattern. Democratic women were more ideologically liberal than Democratic men. This aligns with previous literature, which shows that Democratic female voters are more likely to be more liberal than their male counterparts (Gillion et. al 2013; Coffé 2013; Kaufmann 2002; Norrander and Wilcox 2008; Pratto et. al 1997). This information allows a connection to be formed between the way that women vote for their representatives and the way that female representatives vote once in Congress. Both female voters and representatives are seen to be more ideologically liberal than male voters and representatives.
Figure 1 also shows that, while over time there were shifts in ideology for Democratic men and women in Congress, both men’s and women’s placement on the ideological scale in the 103rd House is nearly identical to their placement on the ideological scale in the 115th House. Beginning in the 103rd House, Democratic women began to pull away from Democratic men, becoming more liberal. In the 110th House, however, women and men became more closely ideologically aligned and they more or less stayed that way until the 115th House. It appears that women have begun to pull away from men again in the 116th House. It is impossible to know for sure since this could be an outlier, similar to the 113th House. Another interesting finding from Figure 1 is that men stayed more ideologically consistent than women did. This begins to answer the research question, as it shows that over time Democratic women are more ideologically diverse than Democratic men. In other words, over time, the range of NOMINATE scores from most liberal to most conservative is higher for women than for men. Though Democratic women are leaning liberal, NOMINATE scores of women span a greater distance across the political spectrum than the NOMINATE scores of men.
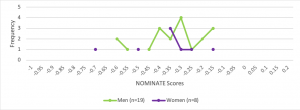
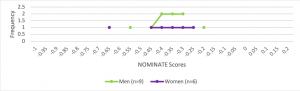
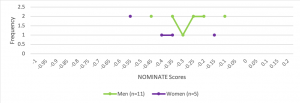
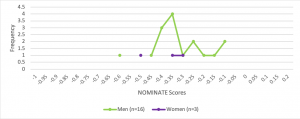
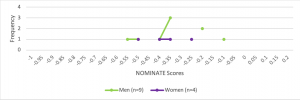
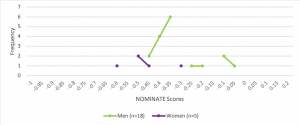
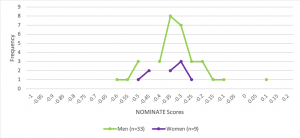
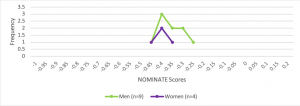
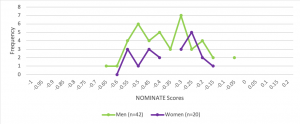
Figures 2 through 15 show the breakdown of NOMINATE scores of Democratic women and men for the 116th through 103rd House of Representatives. These figures allow a more comprehensive understanding of the results summarized in Figure 1. For the 103rd, 104th, 105th, 107th, 108th, and 111th Houses (Figures 15, 14, 13, 11, 10, and 7 respectively), all of the NOMINATE scores of women fall within the range of NOMINATE scores for men. For these years, the Democratic men were more ideologically diverse than women. However, for the 106th, 109th, 110th, 112th, 113th, 114th, 115th, and 116th Houses (Figures 12, 9, 8, 6, 5, 4, 3 and 2 respectively), some of the NOMINATE scores of women fall outside of the boundaries of the range of the NOMINATE scores for men. From this data, it can be concluded that women are becoming more ideologically diverse. For all of these besides the 113th House, the lowest NOMINATE score (most liberal) belonged to women, while the highest NOMINATE score (most conservative) belonged to men. Again, although Democratic women are leaning liberal, NOMINATE scores of women span a greater distance across the political spectrum than the NOMINATE scores of men.
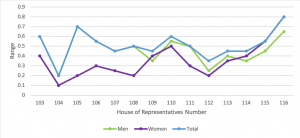
Figure 16 shows the ranges of NOMINATE scores for Democratic men and women for the 103rd through 116th House of Representatives. This figure shows that the 109th House, was the first instance I studied where women were more ideologically diverse than men. From the 110th House to the 113th House, men continued to be more ideologically diverse than women. However, for the 114th, 115th, and 116th House, women were more ideologically diverse than men. From this figure on conjunction with the rest of my findings, it can be concluded that over time women are becoming more ideologically diverse in general and are becoming more ideologically diverse than men, while men are stay more ideologically consistent.
Meaning Behind the Numbers
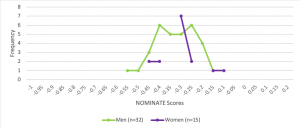
The 2018 midterm elections, leading to the 116th Congress, is extremely interesting to look at in terms of these findings. The 116th House of Representatives is represented in Figure 2, which shows that, for the first time, the NOMINATE scores of the newly elected Democratic men fit within the ideological range of the newly elected Democratic women. In all other Houses, the span of NOMINATE scores of men and women varied, usually with men leaning more conservative and women leaning more liberal. Though women’s scores spanned a greater distance than men’s, this could have been attributed to men’s and women’s roll call votes simply being different due to a number of reasons, such as the values they form, as previously discussed. However, in the 116th House, the span of NOMINATE scores for women is so much greater than the span of NOMINATE scores for men, that all of the NOMINATE scores for men fall within the range of NOMINATE scores for women. There is no newly elected Democratic man more liberal or more conservative than the newly elected Democratic women in the 116th House. This exemplifies my findings that women are becoming more ideologically diverse than men.
The 116th House welcomed the most ideologically liberal female representatives out of the Houses utilized for this study. This shows that there was certainly something unique about the 2018 elections, who was motivated to run, and who voters elected into office. Looking at the 14 figures that chart data about 14 congresses since 1993, it is clear that the 116th Congress is different than the rest due to many variables such as the high number of women elected, and the ideological diversity of the women elected. It is important to note that the 116th House has a very particular type of ideological diversity, leaning very liberal, though technically still more diverse. If looking at the 116th House on the full scale from -1 to 1, the newly elected representatives do not appear to be very ideologically diverse, as their scores range only from -0.9 to -0.1, with no one crossing the boundary of 0 into the “conservative” range. However, if comparing the 116th House to previous Houses, the newly elected representatives cover a wider spread on the NOMINATE scale than ever before.
While it is unclear what implications this may have for future elections because there is no way to determine if these trends will continue, there are some possible conclusions that can be drawn. In looking at Figure 1, it is clear that trends of Congresses becoming more or less liberal often do continue, as they did from the 103rd House to the 109th House. It is also clear, however, that there can be outliers, such as the 111th House and the 113th House. These trends and outliers create an incomplete picture and mean that any conclusions drawn must be done so without a degree of certainty. The outcomes of the 2018 elections, however, provide extremely interesting results that can still be analyzed and interpreted in a manner that, while uncertain, may be useful in understanding what happened and what this means for the future of Congress.
The 2018 elections lead to a very polarized House, but a more ideologically diverse Democratic party. This can be understood to be happening because the most liberal members of the Democratic party are becoming more liberal, but the most conservative members are not becoming any less conservative. On a graph, this may appear as though the Democratic party is technically more ideologically diverse, though they are moving farther away from the center. Though the most liberal newly elected Democrat in the House of Representatives is a woman, so is the most conservative. It is interesting to note that while women can be understood as being more ideologically diverse than men, they appear to be playing both sides by pulling the Democratic party more liberal while at the same time staying as moderate as the men in the party.
If this outcome is applied to voters — which can be done so only very loosely, as this study did not include any data on voters or voting patterns, and any conclusions drawn can be done so only by inference — it could be hypothesized that liberal Democratic voters are becoming more liberal, while conservative Democratic voters are staying consistent. Though the term ideological diversity seems as though it would be working towards a more cohesive and less polarized Congress, the opposite would probably need to happen for this effect to actually happen. Liberal Democrats would need to become less liberal and conservative Democrats would need to become more conservative, and vice versa for the Republican party. These inferred voting patterns would be interesting data to study and conclude if they are true or not.
Though these conclusions are somewhat uncertain, consequences of and the ways in which the 2018 elections shape American democracy moving forward seem to be, from this study, defined by women’s involvement in politics. When looking at ideology, and particularly ideological diversity, it is clear that women make an impact. The three Houses that had the most ideological diversity included three out of the top four Houses with the most amount of women representatives. It is interesting that not only are women generally more liberal than men, but they are more ideologically diverse. This means that while some women are more liberal, the way men and women representatives legislate is probably not very different. There are many liberal-leaning women in Congress, but also many liberal-leaning men, and the same can be said for moderate leaning representatives of both genders. It is unclear how this impact is made or why ideologies differ with the presence of more women, but it appears that a difference is made. If the 2018 elections act as a precedent for future elections, not only more women in Congress, but a more ideologically diverse, liberal-leaning Democratic party could be expected.
There are many factors, such as media and current presidency, that can impact the ideologies of the representatives currently in office, and the potential candidates that decide to run. It is likely that these factors made an impact on the newly elected Democrats in the 116th Congress, though this data cannot support or oppose this claim. This data can, however, make suggestions about the condition of polarization that has been plaguing Congress for many years (Desilver 2014, Ingraham 2015, Waldman 2010). One drawback of this research is that I compiled the NOMINATE scores of the 116th House of Representatives in March of 2019. Because of this, the NOMINATE scores used in this paper may change significantly by the end of the term. Also, except for the 116th House, there were many more men elected than women, which may make the results difficult to interpret, since it is difficult to compare studies with all different sample sizes. I am also only studying the Democratic party. This implies limitations on my findings, as the range that I am using should range from -1 to 1, however there is no Democrat included in my study with a score higher than .2. There is still clustering that is occurring in Congress, though there is a move towards greater ideological diversity.
Conclusion
The 2018 elections lead to the most women being elected into political office, sparking many questions surrounding the newly interesting 116th Congress, such as those surrounding ideology. With Congress becoming increasingly polarized, ideology is a highly contested topic leading to many differing conclusions. Focusing on certain aspects of ideology, such as ideological diversity, can aid in creating a more in-depth understanding of what is happening in Congress and why. By using NOMINATE scores, ideology can be measured for current and past members of Congress, allowing for a study of where Congress is going, in terms of ideology, and where it has been.
My study aimed to answer the question: how has the ideological diversity of the Democratic party changed over time, based on gender diversity? All data collected refers to newly elected Democratic members in the House of Representatives. Though my study had some unavoidable limitations, such as the number of women elected to the House each year being less than the number of men elected to the House each year, besides 2018, I conclude that the House is becoming more ideologically diverse over time and that women in the House are more ideologically diverse than men. While there has not been a linear progression of more women being elected into the House each year, over time there is a trend towards greater congressional participation by women. It is unclear the causation, correlation, and impact of these findings. Some possibilities, such as what this means for the future of Congress and elections can be loosely discussed.
My findings suggest that there is a connection between the growing number of women being elected into office and the ideological diversity of the House becoming greater over time. However, ideological diversity should not be equated to more moderate or less polarized. The Democratic party is becoming more ideologically diverse, but the most conservative members are not shifting any closer to or further away from the center. On the other hand, the most liberal members are shifting closer to the left, causing the range between most conservative member and most liberal member to increase. In the 116th Congress, women are more ideologically diverse than men. The range of NOMINATE scores for the newly elected Democrats are bookended on both sides by women.
While greater ideological diversity cannot be equated to a less polarized Congress, it is indicative of a greater portion of the political spectrum being represented in the House. It should be the goal of Congress to be representative of all citizens, and greater ideological diversity allows for the voices of citizens all across the spectrum to be heard, though it may not contribute to a more cooperative bipartisan House. In looking at previous scholarship, I found that women value issues differently than men. This may be one source of women’s greater ideological diversity. While future Houses should aim to span their ideological diversity in both directions — towards being more liberal and more conservative — the ideological diversity of the 116th House shows a move towards a more representative Congress that is more inclusive of all, particularly women’s, voices.
Appendix
Figure 1. Mean NOMINATE Scores of New Democrats
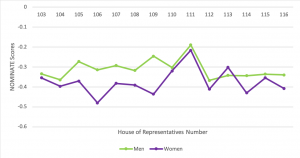
Source: voteview.com
Figure 2. Ideological Spread of New Democrats of the 116th House
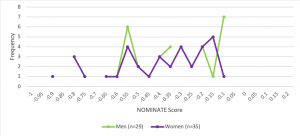
Source: voteview.com
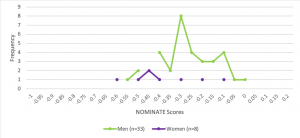
Figure 3. Ideological Spread of New Democrats of the 115th House
Source: voteview.com
Figure 4. Ideological Spread of New Democrats of the 114th House
Source: voteview.com
Figure 5. Ideological Spread of New Democrats of the 113th House
Source: voteview.com
Figure 6. Ideological Spread of New Democrats of the 112th House
Source: voteview.com
Figure 7. Ideological Spread of New Democrats of the 111th House
Source: voteview.com
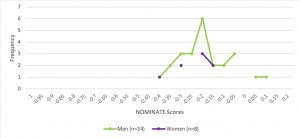
Figure 8. Ideological Spread of New Democrats of the 110th House
Source: voteview.com
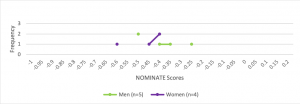
Figure 9. Ideological Spread of New Democrats of the 109th House
Source: voteview.com
Figure 10. Ideological Spread of New Democrats of the 108th House
Source: voteview.com
Figure 11. Ideological Spread of New Democrats of the 107th House
Source: voteview.com
Figure 12. Ideological Spread of New Democrats of the 106th House
Source: voteview.com
Figure 13. Ideological Spread of New Democrats of the 105th House
Source: voteview.com
Figure 14. Ideological Spread of New Democrats of the 104th House
Source: voteview.com
Figure 15. Ideological Scores of New Democrats of the 103rd House
Source: voteview.com
Figure 16. Range of NOMINATE Scores
Source: voteview.com
References
Bacon, Perry. “Why Democrats Elect Way More Women Than Republicans: Tennessee Edition.” FiveThirtyEight. August 03, 2018. Accessed April 10, 2019. https://fivethirtyeight.com/features/tennessee-primary-results-gender/.
Boxell, Levi, Jesse Shapiro, and Matthew Gentzkow. “The Internet, Political Polarization, and the 2016 Election.” Research Briefs in Economic Policy 88 (November 2017). https://object.cato.org/sites/cato.org/files/pubs/pdf/research-brief-88.pdf.
Burden, Barry C, Gregory A. Caldeira, and Tim Groseclose. 2000. “Measuring the Ideologies of U.S. Senators: The Song Remains the Same.” Legislative Studies Quarterly 25(2): 237-258. www.jstor.org/stable/440370.
Coffé, Hilde. 2013. “Women Stay Local, Men go National and Global? Gender Differences in Political Interest.” Sex Roles 69: 323-338. doi:10.1007/s11199-013-0308-x.
Coffey, David. 2005. “Measuring Gubernatorial Ideology: A Content Analysis of State of the State Speeches.” State Politics and Policy Quarterly 5(1): 88-103.
Deckman, Melissa. “What Women Want: Issue Priorities for Women Voters in Election 2018.” Gender Watch 2018. August 10, 2018. Accessed March 22, 2019. https://www.genderwatch2018.org/what-women-want/.
DeSilver, Drew. “The Polarized Congress of Today Has Its Roots in the 1970s.” Pew Research Center. June 12, 2014. Accessed April 11, 2019. https://www.pewresearch.org/fact-tank/2014/06/12/polarized-politics-in-congress-began-in-the-1970s-and-has-been-getting-worse-ever-since/.
Gillion, Daniel Q, Jonathan M. Ladd, and Marc Meredith. 2013. “Education, Party Polarization and the Origins of the Gender Gap in U.S. Party Identification.” American Political Science Association.
Graham, David A. “How Far Have the Democrats Moved to the Left?” The Atlantic. November 06, 2018. Accessed March 27, 2019. https://www.theatlantic.com/politics/archive/2018/11/democratic-voters-move-leftward-range-issues/574834/.
Griffin, John D. 2008. “Measuring Legislator Ideology.” Social Science Quarterly 89(2): 337-350.
Grossmann, Matt, and David A. Hopkins. “How Different Are the Democratic and Republican Parties? Too Different to Compare.” The Washington Post. September 08, 2016. Accessed March 27, 2019. https://www.washingtonpost.com/news/monkey-cage/wp/2016/09/08/how-different-are-the-democratic-and-republican-parties-too-different-to-compare/?noredirect=on&utm_term=.6a37ea3adcff.
Hare, Christopher and Keith Poole. 2014. “The Polarization of Contemporary American Politics.” Northeastern Political Science Association 46(3): 411-429.
Ingraham, Christopher. “A Stunning Visualization of Our Divided Congress.” The Washington Post. April 23, 2015. Accessed April 11, 2019. https://www.washingtonpost.com/news/wonk/wp/2015/04/23/a-stunning-visualization-of-our-divided-congress/?utm_term=.03b9a966290a.
Itkowitz, Colby. “A Resurgent Left Wing Is Coming to Congress. Here’s Who They Are and What They Want.” The Washington Post. December 07, 2018. Accessed April 11, 2019. https://www.washingtonpost.com/politics/2018/12/07/resurgent-left-wing-is-coming-congress-heres-who-they-are-what-they-want/?utm_term=.9212e339c5b7.
Jochim, Ashley E., and Bryan D Jones. 2012. “Issue Politics in a Polarized Congress.” Political Research Quarterly 66(2): 352-369. doi:10.1177/1065912912448930.
Judis, John B. “Return of the Republicans.” The New Republic. January 13, 2011. Accessed March 27, 2019. https://newrepublic.com/article/81372/return-of-the-republican-party.
Kapur, Sahil. “How Ocasio-Cortez and Her Fellow Liberal Women Are Changing Their Party.” Bloomberg.com. January 14, 2019. Accessed April 11, 2019. https://www.bloomberg.com/news/articles/2019-01-14/how-ocasio-cortez-and-new-liberal-women-are-changing-their-party.
Kaufmann, Karen. 2002. “Culture Wars, Secular Realignment, and the Gender Gap in Party Identification.” Political Behavior 24(3): 283-307.
Lizotte, Mary-Kate. 2017. “Gender, Partisanship, and Issue Gaps.” Analyses of Social Issues and Public Policy 17(1): 379-405. doi:10.1111/asap.12144.
Lu, Denise, and Keith Collins. “‘Year of the Woman’ Indeed: Record Gains in the House.” The New York Times. November 09, 2018. Accessed March 22, 2019. https://www.nytimes.com/interactive/2018/11/09/us/women-elected-midterm-elections.html.
Moutevelis Coombs, Alexa. “Rolling Stone Gushes Over Liberal ‘Women Shaping the Future’ in Congress.” NewsBusters. March 1, 2019. Accessed April 11, 2019. https://www.newsbusters.org/blogs/culture/alexa-moutevelis-coombs/2019/03/01/rolling-stone-gushes-over-liberal-women-shaping.
Murphy, Nancy. “Stanford Expert Says 2016 Election Reflects New Trends in Money, Media and Polarization.” Stanford News. August 31, 2016. Accessed March 22, 2019. https://news.stanford.edu/2016/08/25/election-reflects-new-trends-money-media-polarization/.
Norrander, Barbara and Clyde Wilcox. 2008. “The Gender Gap in Ideology.” Political Behavior 30: 503-523. doi: 10.1007/s11109-008-9061-1.
Olson, Adam and Paula O’Loughlin. 2009. “Gender in Congress: When Does it Matter?” Midwest Political Science Association.
Poole, Keith T., and Howard Rosenthal. 1997. Congress: A Political-Economic History of Roll-call Voting. Oxford: Oxford University Press.
Pratto, Felicia and Lisa M. Stallworth. 1997. “The gender gap: Differences in political attitude and social dominance orientation.” British Journal of Social Psychology 36: 49-68.
Redman, Shane M. 2016. “Ideas or People? The Relationship between Feminist Values and Representation.” Southern Political Science Association.
Scott, Dylan. “2018 Is the Identity Politics Election.” Vox. November 01, 2018. Accessed March 22, 2019. https://www.vox.com/policy-and-politics/2018/9/21/17850434/2018-midterm-elections-predictions-women-beto-orourke.
Singman, Brooke. “Ocasio-Cortez Wins House Seat, Becoming Youngest Woman Elected to Congress.” Fox News. November 6, 2018. Accessed April 11, 2019. https://www.foxnews.com/politics/ocasio-cortez-wins-house-seat-becoming-youngest-woman-elected-to-congress.
Soergel, Andrew. “Divided We Stand.” U.S. News & World Report. July 19, 2016. Accessed March 22, 2019. https://www.usnews.com/news/articles/2016-07-19/political-polarization-drives-presidential-race-to-the-bottom.
Schaffner, Brian F. “These 5 Charts Explain Who Voted How in the 2018 Midterm Election.” The Washington Post. November 10, 2018. Accessed March 22, 2019. https://www.washingtonpost.com/news/monkey-cage/wp/2018/11/10/these-5-charts-explain-who-voted-how-in-the-2018-midterm-election/?utm_term=.9681dafb6145.
Theriault, Sean M. 2006. “Party Polarization in the US Congress.” Party Politics 12(4): 483-503. Doi: 10.1177.1354068806064730.
Thomsen, Danielle M. 2010. “Ideological Moderates Won’t Run: How Party Fit Matters for Partisan Polarization in Congress.” The Journal of Politics 76(3): 786-797. doi: 10.1017/S0022381614000243.
Thomsen, Danielle M. 2015. “Why So Few (Republican) Women? Explaining the Partisan Imbalance of Women in the U.S. Congress.” Legislative Studies Quarterly 40(2): 295-324. doi:10.1111/lsq.12075.
Waldman, Paul. “How Congress Became Polarized.” The American Prospect. October 18, 2010. Accessed April 11, 2019. https://prospect.org/article/how-congress-became-polarized-0.
