Gender in New Digital Era: Facebook Campaigning
Lauren Wohlgemuth
Two hundred and fifty six million dollars spent in five months on 1.6 million political advertisements on Facebook, averaging $160 per ad. Facebook has made it especially easy for candidates to campaign directly to voters at low cost. As Facebook campaigning is so new, it is important to examine how and if candidates are using it differently when compared to conventional TV ads and other forms of campaign communication. Which leads to the focus of this study: How do congressional candidates use Facebook for campaigning purposes? The 2018 Year of the Woman elections are rich terrain for studying the role of gender in Facebook campaigning. There were many milestones in 2018, not least important of which was a record amount of women ran for and won seats in Congress. Using Facebook’s Advertisement Library, this study examines Republican and Democratic candidates’ use of Facebook for campaigning purposes with a particular focus on gender and age differences, as well as election outcomes. In brief, I find no significant correlations found between gender, age, political party, or election result and the frequency of candidates posts on Facebook during the month before Election Day. However, as time goes on and Facebook becomes a more integral part of society, Facebook may have more of an impact on campaigns and election outcomes. For this, it is important to continue to study Facebook’s impact on campaigns.
Early Campaign Uses of Social Media
The general use of social media has been on the rise in the past decade, increasing by 20% in the past five years (Smith and Anderson 2018). It is quite astonishing, as twenty years ago “social media” was a foreign concept. Facebook, being at the forefront of the new tech age, has 1.44 billion active users every month (Baran and Knautz 2016). Facebook has the ability to reach billions of people through a single, low cost platform. Facebook’s global reach is changing the ways businesses advertise their products, revolutionizing the marketing industry. As of 2018, companies, on average, allot 10% of their marketing budget for social media advertising, which is projected to grow to 20% in the next five years (Cooper 2018). Marketing a product for a business is just as important as campaigning is to an electoral race. Campaigning, in fact, is a form of marketing, so it is expected we see a shift in campaign funds to go towards social media marketing. Based on figures from Borrell Associates, “politicians will be allocating over 9 percent of media budget towards digital and social media— this comes to an estimated $1 billion” (Rohan 2016). In the 2018 election it was reported that Senate candidates spent approximately $17.5 million on Google and Facebook advertisements. For candidates in competitive House races, candidates spent $2.1 million on Facebook and Google (Evers-Hillstrom 2018). Candidates can spend anywhere from less than $100 to as much as $5000 per advertisement post on Facebook. These figures reflect the growing importance of social media’s role in campaigning. Political social media budgets will most likely only grow–exponentially.
Social media has changed the way we communicate and interact with each other. According to the Pew Research Center, Facebook is a top news source for internet users, with 48% of web users saying they got news about government and politics from Facebook in the past week (Mitchell, Matsa, Gottfried, and Kiley 2014). However, constituents who are actively seeking political news mainly get their information through TV news broadcasts, with using this source at least five times a week (Shehata, and Strömbäck 2018). Nonetheless, traditional news media consumption is declining, with social media on the rise. As using social media, specifically Facebook, as a news source is on the incline, studies note that exposure to political news on Facebook mostly occurs incidentally (DeSilver 2014). People may not be going to Facebook to gain political knowledge, but they are still encountering political news while using it. This data gives importance to why politicians have started to use social media platforms, such as Facebook, for campaigning purposes.
Internet campaigning did not start with social media. Most candidates started using the web for campaign purposes in the early 2000s. In 1998, only 72% of major party Senate candidates had campaign websites, however, six years later in 2004, 92% of candidates had one (Drunkman, Kifer, and Parkin 2009). Studies have shown that a large percent of Senate candidates in the 2002 and 2004 elections used campaign websites. However, different types of candidates used their websites differently. Incumbents were 61.3% less likely to update their websites compared to their challengers. In addition, Senate candidates are two-and-a-half times more likely to update their websites than House candidates (Drunkman, Kifer, and Parkin 2009). These figures suggest that candidates who feel more secure, in less competitive races, do not use online media as often.
Social media started to be used as a campaign tool in 2006. Candidates adopted the use of social media because it was a way they could directly interact with their constituents. Facebook offers many services to candidates to help them with their campaigning. Specifically, Facebook has a team that will meet with candidates and offer assistance with using their advertising services (Rohan 2016). Social media consultant, Erin Lindsay, notes it is important for candidates to have various tones for different social media platforms. On Twitter, candidates should be ready to answer controversial questions, where on Facebook they should show more concern and warmth. The key, however, is to always be authentic (Rohan, 2016). Facebook, in addition to their candidate consulting services, started to offer a service to help organize the candidates for the general use. “Facebook launched a complementary section within the main site called Election Pulse. It created, free of charge, generic profiles of all candidates running for a congressional or gubernatorial seat. Facebook posted the candidate’s name, office, state, and party affiliation, while grouping them by state and congressional district for easy locating” (Gulati and Williams 2013). This would not only help candidates but also constituents as they navigate the electoral field. Facebook now wants to revolutionize the way candidates communicate with their constituents by allowing them to create video monologues to discuss their campaign goals (Constine 2018).
Campaign goals are now easier for candidates to achieve as social media makes communication more efficient and can target the correct demographics. Campaign media strategist Joe Trippi states that it took six months in 2004 to gain nearly 139,000 emails for a mailing list when several years later it took one Facebook group barely a month to collect 200,000 email address (Slotnick2009). Facebook made it easier for candidates to reach and communicate with constituents. It was also found that 64 of the 66 candidates running for the Senate in 2012 had a Facebook page. Based on Gulati and William’s study, they also discovered that younger candidates were more likely to adopt a Facebook page than older candidates. Gulati and William’s research suggests that age is related to political candidates’ adoption of Facebook, at least in the 2012 election.
There are other things we could consider about a candidate’s demographic, like their gender, or candidates sex. As 2018 is now considered the “Political Year of the Woman” we must consider the role of gender in politics. Atkenson examines political involvement of women and how it motivates women in political engagement (Atkenson 2003). Women are more motivated to participate in politics due to changing political circumstances.This is especially true in 2018 as a couple years prior there was a huge shift in political circumstances when President Trump was elected into the White House. Candidates carefully present themselves in certain ways during election periods. For women, it is important for them to showcase themselves in such a way that presents them as viable candidates (Banwart and Winfrey 2013). Banwart and Winfrey examined the webpages of House candidates in the 2012 election, searching for how candidates present themselves in the media. They found few significant differences: women were more likely to post about agriculture issues and equal pay for women compared to men who were more likely to discuss budget deficits. They also discovered women and men candidates portrayed their tone and voices differently, as women used the strategy of being the voice of the state while men more often called for change (Banwart and Winfrey 2013).
Hayes and Lawless did extensive research on candidate messaging on Twitter and campaign ads in 2010 and 2014. They conducted their research by looking at the campaign ads from 2010 and Twitter feeds from candidates from 2014 and coding certain messages under a series of categories, controlling for gender and political party (Hayes and Lawless, 2016). Their results noted that there was no significant difference between men’s and women’s campaign messaging. However, there were many things they did not consider, including the emphasis candidates placed on particular issues and whether or not men and women use social media with different frequency.
Facebook not only helps candidates campaign on their platform, but offers their “Ad Library” service to help users navigate political advertisements. “The archive shows you the ads, their cost, and their reach, which is broken down by basic demographic information that includes gender, location and age” (Kozlowska 2018). This tool helps constituents search for the politicians in their districts. Users can also search for specific issues that interest them. There has been research done on the messaging of candidates, based on gender, and the political reach of Facebook but none has considered how Facebook usage of candidates differ, based on the candidate’s demographic.
How to Assess Facebook Advisements as a Campaign Tool
To examine Facebook usage in the 2018 election, I examined competitive congressional races. I used a list of some of the most competitive races in the election published by “The Guardian” fifty days before the election took place. The list was authored by Ben Jacobs and Sam Morris (Jacobs and Morris 2018). I used their listings of the most competitive Senate and House of Representatives races, totaling 14 races. I also considered information available at “Ballotpedia,” a website providing a list of the battlegrounds of the 2018 U.S. House races. The list accounts for the political party of the candidate and if the seat experienced a partisan change. I adjusted my sample by adding additional races in which female Republicans were running for office in order to gain partisan diversity in my sample of women (since most women who ran in competitive races in 2018 were Democrats). Using Facebook’s Ad Library–which complies all advertisements, active or inactive, related to politics or issues of national importance since May 2018–I searched each Democratic and Republican candidate from the 23 races under examination. I filtered out all ads not sponsored by the candidate. The purpose of this was to only focus on advertisements the candidate released. I did not want to include ads put out by third party sources since the candidate does not control how many times they post and does not finance the ads. I recorded how many times each candidate posted a political ad the month before the election, only counting ads from October 6th to November 6th.
In addition to recording how many times candidates posted a month before the election, I also noted their names, electoral district, party, age and electoral outcome (win or loss). Political party, age, and gender/sex were noted to examine potential gender and age differences among candidates. Figure 1 shows the full data set that was used. There were 46 candidates sampled. Candidates’ ages ranged from 29 to 75 years old.
Table 1. Data
| Candidate and Race | Party | Gender | Age | Number of FB Posts One Month Before The Election | Did They Win? |
| McSally-AZ(S) | R | W | 53 | 16 | N |
| Sinema-AZ(S) | D | W | 42 | 451 | Y |
| Tester-MO(S) | D | M | 62 | 3 | Y |
| Rosendale-MO(S) | R | M | 58 | 8 | N |
| Rosen-NV(S) | D | W | 61 | 258 | Y |
| Heller-NV(S) | R | M | 58 | 9 | N |
| Bresden-TN(S) | D | M | 75 | 0 | N |
| Blackburn-TN(S) | R | W | 66 | 25 | Y |
| Manchin-WV(S) | D | M | 71 | 21 | Y |
| Morrissey-WV(S) | R | M | 51 | 0 | N |
| Rouda-CA48th | D | M | 57 | 26 | Y |
| Rohrabacher-CA48th | R | M | 71 | 8 | N |
| Hill-CA25th | D | W | 31 | 10 | Y |
| Knight-CA25th | R | M | 52 | 0 | N |
| McGrath-KY6th | D | W | 43 | 155 | N |
| Barr-KY6th | R | M | 45 | 8 | Y |
| Underwood-IL14th | D | W | 32 | 182 | Y |
| Hultgren-KY14th | R | M | 53 | 16 | N |
| Finkenauer-IA1st | D | W | 30 | 6 | Y |
| Blum-IA1st | R | M | 63 | 14 | N |
| Kim-NJ3rd | D | M | 36 | 106 | Y |
| MacArthur-NJ3rd | R | M | 58 | 16 | N |
| Delgado-NY19th | D | M | 42 | 7 | Y |
| Faso-NY19th | R | M | 66 | 15 | N |
| Allred-TX32nd | D | M | 32 | 11 | Y |
| Sessions-TX32nd | R | M | 64 | 26 | N |
| Brown-WA5th | D | W | 62 | 17 | N |
| Rodgers-WA5th | R | W | 49 | 14 | Y |
| Omar-MN 5th | D | W | 37 | 3 | Y |
| Zielinski – MN5th | R | W | 36 | 2 | N |
| Haaland-NM 1st | D | W | 58 | 6 | Y |
| Jones-NM 1st | R | W | 67 | 21 | N |
| Ocasio-Cortez-NY 14th | D | W | 29 | 59 | Y |
| Pappas-NY 14th | R | M | 72 | 0 | N |
| Hill-AK 2nd | R | M | 62 | 16 | Y |
| Tucker-AK 2nd | D | M | 38 | 24 | N |
| Kirkpatrick-AZ 2nd | D | W | 69 | 5 | Y |
| Peterson-AZ 2nd | R | W | 48 | 6 | N |
| Axne – IA 3rd | D | W | 54 | 4 | Y |
| Young – IA 3rd | R | M | 50 | 12 | N |
| Powell- FL 26th | D | W | 48 | 6 | Y |
| Curbelo – FL 26th | R | M | 39 | 11 | N |
| Davids-KS 3rd | D | W | 38 | 2 | Y |
| Yoder-KS 3rd | R | M | 43 | 4 | N |
| Wild – PA 7th | D | W | 61 | 18 | Y |
| Nothstein – PA 7th | R | M | 48 | 18 | N |
Does Facebook Usage for Campaigning Differ Among Certain Types of Candidates?
The first aspect of my data that I assessed was the average number of times women and men candidates posted to Facebook. There were a few male candidates who did not post anything on Facebook, bringing the overall average down. With that, I found it important to include them in my dataset as it would show a more accurate picture of Facebook usage among the candidates. On average, men running for Congress posted on Facebook 15.6 times during the month before Election Day. Women candidates, in contrast, posted on average 60.3 times. Every women candidate included in my sample posted a political ad on Facebook at least one time. Taking into consideration outliers (e.g., no posters and extremely frequent posters) I calculated the median number of posts among women and men. The results were as such: the median for men candidates was 11 posts and for women candidates 14 posts. With these figures, it is hard to say there are significant differences between female and male candidates.
The next set of data I examined was comparing the candidates age and gender with how many times they posted Facebook ads a month before the election. Figure 2 represents this data.
Figure 1. Facebook Use in 2018
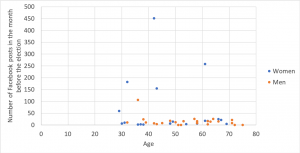
The age of the candidate is listed on the x-axis as the number of times they posted on Facebook is listed on the y-axis. After analyzing the scatterplot, most dots lie in the lower right quadrant. However, there seems to be no trend between the age of the candidate and the amount of times they posted. It seems that most candidates post between ten to twenty-five times. There was only one male candidate who posted more than 26 times, posting 106 times. He was on the younger end of the candidates in the sample, being 36 years old. However, there are no significant trends among the age of male candidates and how many times they post advertisements on Facebook overall. I also examined the age of female candidates and how many times they posted an ad on Facebook a month before the election. There are similar findings for women; there are no significant trends between a candidates age and how many times they post advertisements on Facebook. While all women in my sample used Facebook as a campaign tool, where some men who did not.
In addition to age and gender, I also recorded if the candidate won their race. This will be very interesting to see if candidates who posted more won the election. Of the 23 races I evaluated, 11 of them who posted more frequently won. Out of my sample, there does not seem to be a strong correlation between the number of posts a candidate makes on Facebook and the outcome of their election. However, I do believe that as time goes on and the use of Facebook becomes more incorporated in our daily life, Facebook will have more of a correlation with election results. To examine just the Senate races, all the candidates besides one, who posted more won their race. We cannot say that posting more advertisements on Facebook will lead to victory but a continuation of this study in the upcoming elections could be helpful in future campaigns.
One more way to analyze this data is to look at whether or not political party has a significance effect on a candidate’s use of advertisements on Facebook. In order to do so, I sorted my data by Republican and Democratic candidates. Once, I did that I found the average amount of posts per political party. On average, Democratic candidates posted 60 times in the month leading up to Election Day; among Republicans, this number was 11.5 times. There can be many explanations for this. However, based on my data, 65% of the Democrats sampled were women. As previously discussed, female candidates on average tend to post more advertisements on Facebook than male candidates. Since more women who are were from the Democratic party, we can see a relationship between the two. However, it is hard to tell if gender has an impact on the quantity of Facebook posts or if political party is the driving factor. Looking at the data for the Republican Party, only 26% of the sample were women. In addition to looking at just the averages between Democrats and Republicans, I also found the medians of the two. The median number of times a Democratic candidate posted a month before the election on Facebook in my sample was 11; the median for Republican candidates was 12.
Facebook Campaigning in the Future
As previously discussed, I did not see observable significant correlations between candidates’ gender, age, political party, or election outcome and the frequency of posts on Facebook a month before the election. However, Facebook campaigning is still important to study as it is becoming more popular for candidates to use during their races. As previously discussed, more funds are being allocated to social media campaigning and that trend is expected to continue. It will be interesting to see if Facebook campaigning significantly differs between candidates in the 2018 election and in future elections. Not only does Facebook campaigning impact candidates, but it also shapes how voters interact with candidates. Voters are now shifting from getting their political news from TV news to online social media platforms. As voters get more of their information from social media, candidates will start to pay more money and attention to their social media campaigns. In the future, as voters continue to get their political news from social media, candidates who decide not to post on social media will not reach as many constituents and their performance in the elections might falter because of it. The only things we do know for sure, however, is that social media will continue to impact our daily lives in many facets whether that be in politics or generally.
References
Atkeson, Lonna Rae. 2003. “Not All Cues Are Created Equal: The Conditional Impact of Female Candidates on Political Engagement.” The Journal of Politics 65, no. 4: 1040-061. doi:10.1111/1468-2508.t01-1-00124.
Banwart, Mary Christine, and Kelly L. Winfrey. 2013. “Running on the Web: Online Self-Presentation Strategies in Mixed-Gender Races.” Social Science Computer Review 31, no. 5 (October): 614–24. doi:10.1177/0894439313490390.
Baran, Katsiaryna S., and Knautz, Kathrin, eds. 2016. Facets of Facebook : Use and Users. Berlin/Boston: De Gruyter, Inc.. Accessed March 11, 2019. ProQuest Ebook Central.
Constine, Josh. 2018. “Facebook Launches Candidate Info Where Politicians Pitch on Camera.” TechCrunch. October 24. Accessed March 21, 2019. https://techcrunch.com/2018/10/24/facebook-candidate-info/.
Cooper, Paige. 2018. “Social Media Advertising Stats That Matter to Marketers in 2018.” Hootsuite Social Media Management. June 06. Accessed March 21, 2019. https://blog.hootsuite.com/social-media-advertising-stats/.
Drunkman, James N., Martin J. Kifer, and Michael Parkin. 2009. “The Technological Development of Candidate Web Sites: How and Why Candidates Use Web Innovations.” In Politicking Online: The Transformation of Election Campaign Communications, edited by Panagopoulos Costas, 21-47. New Brunswick, New Jersey; London: Rutgers University Press. http://www.jstor.org.muhlenberg.idm.oclc.org/stable/j.ctt5hj455.6.
DeSilver, Drew. 2014. “Facebook Is a News Source for Many, but Only Incidentally.” Pew Research Center. February 07. Accessed March 21, 2019. https://www.pewresearch.org/fact-tank/2014/02/04/facebook-is-a-news-source-for-many-but-only-incidentally/.
Gulati, Girish J., and Christine B. Williams. 2013. “Social Media and Campaign 2012: Developments and Trends for Facebook Adoption.” Social Science Computer Review 31, no. 5 (October): 577–88. doi:10.1177/0894439313489258.
Hayes, Danny, and Jennifer L. Lawless. 2016. Women on the Run: Gender, Media, and Political Campaigns in a Polarized Era. S.l.: S.n..
Evers-Hillstrom, Karl. 2018. “Presidential Hopefuls Spend Big on Digital Ads; House Candidates Stick with TV.” OpenSecrets News. October 22. Accessed April 21, 2019. https://www.opensecrets.org/news/2018/10/potus-hopefuls-spend-big-on-digital-ads/.
Heater, Brian. 2018. “Facebook’s Ad Archive Report Highlights Top Political Spenders – TechCrunch.” TechCrunch. October 24. Accessed May 07, 2019. https://techcrunch.com/2018/10/24/facebooks-ad-archive-report-highlights-top-political-spenders/.
Jacobs, Ben, and Sam Morris. 2018. “The Key 2018 Midterm Election Races to Watch.” The Guardian. September. Accessed April 08, 2019. https://www.theguardian.com/us-news/ng-interactive/2018/sep/17/midterms-2018-candidates-odds-predictions-democrats-republicans-key-races.
Kozlowska, Hanna. 2018. “You Can Now Look through All the Ads for the 2018 Midterm Elections Posted on Facebook.” Quartz. May 24. Accessed March 21, 2019. https://qz.com/1288511/facebook-has-launched-its-political-ads-archive-just-in-time-for-the-2018-midterm-election-season/.
Mitchell, Amy, Jeffery Gottfried, Jocelyn Kiley, and Katerina Eva Matsa. 2014. “Social Media, Political News and Ideology.” Pew Research Center for Journalism and Media, October 21,. Accessed March 12, 2019.
Rohan, Ayyar. 2016. “Here’s How Social Media Will Impact the 2016 Presidential Election.” The Reference Shelf: Campaign Trends & Election Law. Hackensack: Salem. Accessed March 11, 2019. https://online-salempress-com.muhlenberg.idm.oclc.org
Shehata, Adam, and Jesper Strömbäck. 2018. “Learning Political News From Social Media: Network Media Logic and Current Affairs News Learning in a High-Choice Media Environment.” Communication Research, (January). doi:10.1177/0093650217749354.
Slotnick, Allison. 2009. ““Friend” the President: Facebook and the 2008 Presidential Election.” In Politicking Online: The Transformation of Election Campaign Communications, edited by PANAGOPOULOS COSTAS, 249-71. NEW BRUNSWICK, NEW JERSEY; LONDON: Rutgers University Press. http://www.jstor.org.muhlenberg.idm.oclc.org/stable/j.ctt5hj455.18.
Smith, Aaron, Monica Anderson, Aaron Smith, and Monica Anderson. 2018. “Social Media Use 2018: Demographics and Statistics.” Pew Research Center: Internet, Science & Tech. September 19. Accessed March 29, 2019. https://www.pewinternet.org/2018/03/01/social-media-use-in-2018/.
“U.S. House Battlegrounds, 2018.” Ballotpedia. Accessed April 25, 2019. https://ballotpedia.org/U.S._House_battlegrounds,_2018.
