Ideology, Elections, and Gender: Republican Women Voters Crossing Party Lines
Morgan McDevitt
In the political realm, some of the voting population and American individuals make assumptions about how Democrats and Republicans should respond to party politics. Lizotte (2017) finds that “partisanship is a prevailing way that individuals organize their attitudes. Democrats should take the Democratic Party’s positions, and Republicans should take the Republican Party’s positions” (379-405). Similar to how parties are viewed to act, in this paper I explore the thought of partisanship, voting behavior, and this idea of gender in the Republican party. I will discuss how often Republican Women vote across party lines and what we learned about cross party voting among Republican women from the 2018 election. Since women voters as a whole, including Republicans and Democrats, lean and vote more liberal (Dolan 2004; Brians 2005; Norrander and Wilcox 2008; Frederick 2009), I examine my question and use a historical timeline of numerical data to see if some Republican women are as liberal as they say or stay within their party lines. This leads me to my official question of “To what extent might Republican women vote for the Democratic party candidates and what did we learn from Republican women voters in the 2018 election?”.
Since my research question is comparing past elections to 2018, my timeframe includes election cycles from 1982 to 2018, which will widen the scope of understanding how frequently Republican women respond to Democratic House candidates. From 1982 until 1990, an increasing percentage of Republican women voted for Democratic House candidates, but since 1990, there has been an overall decrease of of cross party voting among Republican women (at least in House elections) (“Portrait of the Electorate: Table of Detailed Results” 2010; “CNNPolitics – Political News, Analysis and Opinion” 2014; “Exit Polls” 2014; “2018 Midterms: Exit Polling” 2018). While there is some evidence to suggest that Republican women voters are less likely to reach across the aisle to vote for Democratic House candidate from the 1990s until late 2010s, it is important to explore why certain large spikes and decreases occurred in certain election cycles.
Political Polarization and Cross Party Voting in Politics
Political polarization strong and prevalent. According to the Pew Research Center, “92% of Republicans are to the right of the median (middle) Democrat, compared with 64% twenty years ago” (“Political Polarization in the American Public” 2016). The importance of this this research is that while it may not directly address Republican women, if political polarization is as pertinent and visible , this can help explain the decrease in Republican women voters voting for Democratic House candidates. It also shows that cross party voting is not as visible as it was compared to the early election cycles like the early 1990s. While Fiorina and Abrams (2008) have challenged the Pew Research Center’s data by suggesting that political polarization has not been much different from 2014 as it was in in 1994,[1] they still recognize that political polarization is happening and cross party voting does not happen as much. Abramowitz, Alexander, and Gunning (2006) note that the fact that political polarization can explain why voters staying within party lines (75-88).[2]
Significant Election Cycles for Voters from 1982 to 2018
While voters from both parties are becoming more loyal to their parties, important election cycles like 1992, 2002 and 2004 together, and 2016 and 2018, can shed light on the likelihood, or reasons why, some Republican women voted for Democratic House candidates.
Election cycle of 1992
Carpini and Fuchs (1993) discuss the importance of the 1992 election cycle and the impact it had on society. They conclude that while there was extreme economic, governmental, and social turmoil, this election cycle benefitted women candidates when they were running and helped them to gain seats in different government positions (Carpini and Fuchs 1993). While this is important to acknowledge that women candidates overall benefitted from this economic and social downfall, quantitative data shows that it did not make Republican women more likely to reach across the aisle for the Democratic House candidate or for a woman candidate from the opposing party.
Republican women voters’ extent of voting for the Democratic House candidate drastically decreased from 1990 to 1992 by 11 percent (“Portrait of the Electorate: Table of Detailed Results” 2010; “CNNPolitics – Political News, Analysis and Opinion” 2014; “Exit Polls” 2014; “2018 Midterms: Exit Polling” 2018). So, while in general 1992 may have helped women candidates that does not mean that Republican women voters were more likely to reach across party lines to vote for a Democratic candidate. In fact, the social, political, and economic turmoil can offer perspective on why there was the most drastic decrease.
Election Cycles of 2002 and 2004
During the election cycles of 2002 and 2004, most House elections were not competitive races, due to the power of incumbency (Abramowitz, Alexander, and Gunning 2006, 75-88). Abramowitz, Alexander, and Gunning (2006) suggest that political polarization and partisanship can help protect incumbent seats, which leads to races becoming noncompetitive. Similar to my research, while viewing the exit polls of the elections of 2002 and 2004 from the CNN and The New York Times, they do not find drastic decreases or increases of Republican women voting for the Democratic House candidate in 2002 or 2004.
2016 to 2018 and the Age of Trump
When Trump was elected in 2016, there were different perspectives and mixed reviews on how people felt about him being president, even within the Republican party. Moving onto 2018, in light of Trump, Republican party members, both women and men, have spoken out against Trump and scholars have viewed how candidates of the Republican party respond to Trump, how they differ from his stances, and how Trump responded to these candidates when they disagree with him (Liu and Jacobson 2018, 49-71). Liu and Jacobson’s (2018) research offers perspective as to how Trump alienates his own party and can help understand that not all Republicans vote and respond the same way. Some Republican candidates do not always vote strictly within the party lines or within Trump’s view, so the same can be said about Republican women voters. This research can aid me in moving to make further implications about what can happen with some Republican women voters in the future and if him being President could impact the Republican women voter’s willingness to vote for the Democratic House candidate moving forward in 2018.
Gender and Party Identification of the Republican Party
In order to further understand why certain Republican women vote for Democratic House candidates from 1982 to 2018, it is important to examine the ways that the Republican party constructs gender identity alongside party identification. As mentioned by Sanbonmatsu and Dolan (2008), Republican voters are not as likely to have faith in women when they are involved in politics, do not believe they will perform well in political situations to the same degree as men. Their research is important for considering how some of the Republican party views gender, views women running or holding a political office, and how they communicate this into the whole party. Comparing data from 2000 until 2018, the extent to which Republican women voters vote for the Democratic House candidate is at an average of 6 percent (“Portrait of the Electorate: Table of Detailed Results” 2010; “CNNPolitics – Political News, Analysis and Opinion” 2014; “Exit Polls” 2014; “2018 Midterms: Exit Polling” 2018). In regards to Sanbonmatsu and Dolan’s literature, it can be telling as to why the average 6 percent of Republican women have decided to take the step to vote across party lines and it is important to find overall reasons why this did happen, whether it be in regards to viewing how “liberal” a Republican woman could be and if the Republican women voter wanted to vote for another woman candidate that was not a registered Republican.
Hayes and Lawless (2016) examine if voters from both political parties viewed men and women candidates differently or if their concern was a candidate’s party identification. While the research did not necessarily find this direct link that voters view candidates differently by gender, including the Republican voters, it did reveal that candidates that share the same party or ideological attributes to the voter weighs more than gender. So, while from this literature I cannot draw the significance that the decision of gender went into way Republican women have reached across the aisle to the extent they do, it reveals this further question of which Republican women reaching across the aisle, due to their ideological connection to a candidate of a different party. It can also be used for the argument of why Republican women voter’s percentages of reaching across the aisle are lower because they may have larger ideological connection to their own party, regardless of they are viewed as “more liberal.” Similarly, Reingold and Harrell (2009) suggest that there is political partisanship amongst women, so women will not just reach across the aisle because of a woman candidate running from the other party. While this literature addresses the idea of “party congruence”[3] and having more representation of women can help women become more engaged, they still mention that it does not mean that in the end women will vote for the woman candidate. Both Hayes and Lawless, along with Reingold and Harrell, can offer perspective that Republican women do not necessarily vote across the aisle on the means of gender.
Tendencies of Republican Women Voters.
Certain Republican women (including the Republican women that have reached across the aisle to vote for the Democratic House candidate) and women voters in general, have shown by other researchers and their data that women voters tend to vote more liberal overall (Dolan 2004; Brians 2005; Norrander and Wilcox 2008; Frederick 2009). Based off of past research completed by the Pew Research Center, Democrats and Republicans are becoming increasingly more polarized, not only with party lines, but with ideology, in the sense that Democrats are more far to the left and more liberal, while Republicans lean more to the right and are more Conservative (“Portrait of the Electorate: Table of Detailed Results” 2010). These scholarly articles can be utilized in correspondence to each other because while Democrats are proven to be more liberal in their voting patterns and party platform, as well as women are seen to be more liberal-leaning overall, this literature compliments each other by offering perspective on why, for the small amount of Republican women voters that actually do reach across the aisle, have done so for the Democratic candidate.
However, the percentage of Republican women that reach across party lines is still a small percentage and my research moving forward needs to be cognizant of that. The literature points this out, in regards to the fact that Republican women stay within their party lines and do not necessarily cross their party platform to vote for a female candidate (Brians 2005; Norrander and Wilcox 2008; Barnes and Cassese 2017). So, the small percentages of Republican women reaching across the aisle are more understandable because of the prior scholars that have proven that Republican voters, for the most part, stay in party lines and stay party loyal.
Understanding the Data from Elections in 1982 to 2018
To what extent might Republican women vote for the Democratic party candidates and what did we learn from Republican women voters in the 2018 election?
To answer this questions, I collected data from the National Electorate from CNN and the New York Times exit polls for House races. Like stated before, both sources provide data from years 1982 to 2018, which is the time frame I will be reviewing.
In order to collect House races for how Republican women voted for Democratic House candidates, CNN uses a random sampling method to gather information. By doing a random sample, any exit polling station has an equally likely chance of being selected to participate in this exit poll survey.[5] When visiting a polling station, every voter leaving the it had an equal chance of being asked to take this survey. As for voters who voted early or with an absentee ballot, phone interviews were collected to add to this research (“CNNPolitics – Political News, Analysis and Opinion” 2014; “2018 Midterms: Exit Polling 2018). For the New York Times, they compile their data from Edison Research, which utilized random selection. Like CNN, any polling station could have equally been selected to be used for data and any voter leaving the polling station has an equally likely chance of participating in the survey. Similar to CNN as well, early voters and absentee ballot voter’s information was collected through phone interviews (“Portrait of the Electorate: Table of Detailed Results” 2010; “Exit Polls” 2014). Both CNN and the New York Times used random selection methods and viewed the time period of 1982 to 2018 when collecting exit poll data.[6]
Findings
As shown in Table 1 and Figure 1 there are noticeable and drastic increases of Republican women voters voting for Democratic House candidates from 1982 to 1990. In this time frame, percentages rose from 12 percent then reached the highest peak of 26 percent in 1990. However, from 1990 to 1992, there was the largest decrease of 15 percent of Republican women voting for Democratic House candidates in the time frame which I am reviewing from 1982 to 2018 (“Portrait of the Electorate: Table of Detailed Results” 2010; “CNNPolitics – Political News, Analysis and Opinion” 2014; “Exit Polls” 2014; “2018 Midterms: Exit Polling” 2018).
Table 1. Percentage of Republican Women Who Voted for a Democratic House Candidate and Democratic Women Who Voted for a Republican House Candidate (1982-2018)
| 1982 | 1984 | 1986 | 1988 | 1990 | 1992 | 1994 | 1996 | 1998 | 2000 | 2002 | 2004 | 2006 | 2008 | 2010 | 2012 | 2014 | 2016 | 2018 | |
| Republican Women who voted for Democratic House Candidates | 12% | 15% | 21% | 23% | 26% | 15% | 8% | 12% | 9% | 9% | 6% | 6% | 6% | 9% | 4% | 5% | 5% | 4% | 6% |
| Democratic Women who voted for Republican House Candidates | 9% | 13% | 20% | 17% | 20% | 11% | 10% | 13% | 11% | 11% | 10% | 8% | 6% | 7% | 7% | 6% | 7% | 7% | 3% |
*Data Collected by CNN Exit Polls, The New York Times Archives, and National Electorate Vote*
Figure 1. Percentage of Republican Women Who Voted for a Democratic House Candidate and Democratic Women Who Voted for a Republican House Candidate (1982-2018)
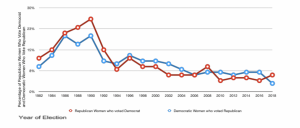
*Data Collected by CNN Exit Polls, The New York Times Archives, and National Electorate Vote*
The election cycle of 1992 had both positive and negative impacts on the voting population in the United States. According to Carpini and Fuchs, the hardships faced in terms of economic turmoil, discontent with governmental actions, and social unrest occurring in the United States was harmful to Americans. However, they do mention that while this may have been occurring, 1992 was the “The Year of the Woman?”. The 1992 election cycle actually helped female candidates in running for political office,[7] as well as the presidential candidate Bill Clinton gain traction, regardless of the hardships that our society was facing during this time (Carpini and Fuchs 1993). The relation to the quantitative data is important because while they claim and support the idea that “Year of the Woman” may have happened in 1992, Republican women voters were not more likely to reach across party lines. Just because it may have benefitted political candidates, primarily Democratic women candidates, the quantitative data shows that it does not provide a correlation to Republican women voters. However, what is important to note is the political, economic, and social turmoil occurring during this time and the decrease in Republican women voters voting for Democratic House candidates. When the article discusses this hardship during the George Bush administration, Republicans (both men and women voters) could have not analyzed the hardships the same way others identified it as and felt to vote within party lines. The qualitative research in correspondence with the quantitative data does not match.
Turning next to 2002 and 2004, Abramowitz, Alexander, and Gunning find that House races were not competitive, and incumbents were basically ensured their seats again (Abramowitz. Alexander, and Gunning 2006, 75-88). In correspondence to the quantitative data in 2002 and 2004 election cycles for Republican women voters voting for the Democratic House candidates, the data shows a steady decline from 2000,[8] but from 2002 to 2006, Republican Women voters voting for the Democratic House candidate kept its steady percentage of 6 percent. Clearly the Republican women primarily voted within party lines for both election cycles and there can be correlation in how the House elections were not competitive and the likeliness of Republican women to vote for the Democratic House candidates.
From 2014 to 2016, House election cycles show that there was only a 1 percent decrease in Republican women voters voting for Democratic House candidates. On the other hand, qualitative data tends to explore why this decrease has occurred in the age of Trump. President Trump who was elected in 2016, has his fair share of opponents, some which reside within the Republican party. Liu and Jacobson (2018) point to how Trump alienates the Republican party, by reviewing how Republican party members different from Trump’s stances, and how Trump responds to people of his party when they do not agree with his rhetoric. Within this research, they discuss how Republicans from 2016 to the present day have been reaching across party lines to vote for candidates in the opposing political party. In relation to the quantitative data, one can see that from 2016 to 2018, there is a 2 percent increase in Republican women voters voting for the Democratic House candidate. While there can be a multitude of reasons, the age of Trump can be partially to related to the fact of this increase of Republican women voting for candidates in the Democratic party. Trump has been a controversial candidate and representation for the Republican party, has been accused of sexual misconduct against women, and has rejected any other Republican party member (including voters) who go against his decisions.
An overarching issue found in the qualitative research in correlation with the quantitative research is the issue with political polarization and partisanship. Past studies have shown that political polarization is relevant and visible in the current political climate and has been evolving since the 1990s (Abramowitz, Alexander, and Gunning 2006, 75-88; Fiorina and Abrams 2008; “Political Polarization in the American Public” 2016). When referencing the data in Table 1 and Figure 1, the large decline of Republican women voters voting for the Democratic House candidate from 1990 to 1992 and the steady decline from 1992 to 2018 (with minimal increases) can find correlation in the concept of political polarization and partisanship. There is a connection between the two variables, as since the 1990s there is a visible decline in numerical data and qualitative data supports that political polarization became prevalent in the 1990s.
The period from 1992 to 2016 began the steep decline of tendencies of Republican women voters going to vote for a Democratic House candidate. After 1990 to 1992, the data suggest a steep decline in Republican women voters reaching across party lines to vote for the Democratic House candidates. Since party polarization and partisanship has been evolving since the 1980s, this can partially factor into why the Republican women voters began to decrease their support for the opposing party. This wide gap between Republicans and Democrats is ever-growing, as seen by the decline in Republican women voters voting across party lines from early 2000s up until the most recent 2018 midterm election. While slight increases and decreases have occurred from the early 2000s until 2018, Republican women voters have not increased their percentages of reaching across party lines at the national level that would resemble percentages found in the 1980s and early 1990s.
2018 Election Synthesis and What to Expect Next
While the 2020 election is still evolving for presidential candidates, past elections may offer a prediction of what to expect when it comes to voting patterns in the future.
Not everyone in the Republican party who votes Republican completely supports the president and because it has been stated that women in general tend to vote more liberal in elections (Dolan 2004; Brians 2005; Norrander and Wilcox 2008; Frederick 2009), moving forward it can be potentially possible that Republican women could increase their percentages of voting for Democratic candidates in the House and in national elections in general. Because of what one has seen with predictions and polling before elections when a lot of the population thought that Hillary Clinton would for certain be the next president, guessing potential outcomes cannot be entirely certain. While not all of the women of the Republican party like President Trump, there are still women within the Republican party that completely support his stances and actions taken with his administration. Even so, further polling data from Reuters shows that on the week of January 7th 2018 that 81.4% of Republican women still “Approve about the way Donald Trump is handling his job as President” while only 16.9% of Republican women “Disapprove about the way Donald Trump is handling his job as President” (“Polling Explorer” 2019). Even in the most recent week time frame reported from April 7th 2019, 83.7% of Republican women “Approve about the way Donald Trump is handling his job as President”, while 14.3% of Republican women “Disapprove about the way Donald Trump is handling his job as President” (“Polling Explorer” 2019).[10] Because of the most recent reports, this would lead me to believe and conclude that from the most recent 2018 midterm election of how Republican women voters voted for Democratic House candidates and how they view how Donald Trump is doing his job, that there will not be a drastic increase in Republican women voting across party lines in 2020 or in the near future. While a slight increase could very well happen, as seen throughout the time frame of early 2000s to 2018, that does not mean that it will inspire numerical values to the degree that we saw in the 1980s and 1990.
Even so, when one looks at specific states and their breakdowns of how they voted in Senatorial and Gubernatorial elections in relation to Republican women voters in the state of Pennsylvania, a swing state. When picking an example, according to CNN exit polling for the most recent 2018 midterm election, Republican women voters in Pennsylvania voting for the Democratic Governor candidate Tom Wolf, was 14%, while Republican women voters in Pennsylvania voting for the Democratic Senate candidate Bob Casey, was 13% (“2018 Midterms: Exit Polling” 2018).[11] Based off of collected exit poll data for a swing state positioned up north, one can see that while individual percentages by states for how Republican women voted for the opposing party in national elections the percentage is higher for Republican women reaching across party lines, 14% and 13% is certainly not something that is a large number that shows Republican women on the individual state level vote for the Democratic party candidates in other national elections.
When one looks at another example of Republican women in a southern state, Florida, one can see the same results that Republican women are not more likely to vote for Democratic candidates on a national level from the 2018 midterm elections. When Republican women voters had the option of the Floridian Democratic governor candidate Andrew Gillium only 7% of Republican women voters voted for him, while for Bill Nelson, a Senatorial candidate for Florida, only 11% of Republican women voters voted for the Democratic Senate candidate for Florida (“2018 Midterms: Exit Polling” 2018).[12] The results of this shows and what one can learn from the 2018 midterm elections is that even from a different swing state located at a different place in the country can still lead similar results for Republican women voters and their likelihood to vote for Democratic candidates at national levels. One can also learn that the likelihood of Republican women voters voting for Democratic House candidates, as well as some Democratic Senate and Gubernatorial races, that Republican women voters do not vote for the Democratic candidates over a certain threshold, specifically over 15 percent.
Future Research Suggestions and Overall Conclusion
Since the 2018 midterm election is thought to be known as “Year of the Woman” and I am a registered Republican woman, I wanted to go beyond how male Republican voters respond in election cycles. Because the 2018 midterm is focused on women, it is important to view how registered Republican women voters with strict party identification respond to the Democratic party and if they could possibly fall into claims that they will not reach across party lines.
Moving forward, for future research I would delve more into to what extend Democratic women voters vote for Republican House candidates and how they respond to national elections. Since I attached how Democratic women have voted for Republican House candidates from 1982 to 2018 in my data to show them in relation to how Republican women vote, I would have liked to explore the dynamic between the two parties with the women voters that reside within both. Even so, understanding how the age of Trump could further impact how Democratic women will vote across party lines in the future. Because while I did not think Republican women voting across party lines will drastically increase, different conclusions could be found for Democratic women voting for the Republican party because of Trump’s actions.
To further add to future research suggestions, I would look into individual states and how their elections for state house races and state senate races show how Republican women would vote for the opposing party. This is to see if there is a similarity or difference for how women respond to their state elections on a smaller level.
While there is always going to be thought that Republican women voters vote only for Republicans and Democratic women only vote for Democrats, there is quantitative data to show that this is not true, but that does not mean that levels of reaching across party lines to vote is at levels it once was.
Notes
[1] Fiorina and Abrams use the wording that political polarization in 2014 is not that different “than a generation ago.”
[2] Another interesting perspective this source adds to my research is that they explain that political polarization in politics has increasingly allowed for House candidate incumbents to further protect their seats. This provides insight to my question because I am specifically looking at the House of Representatives.
[3] “Party congruence”, in reference to Reingold and Harrell, refers to the having agreements and uniformity within parties between the voters and their representatives.
[4] The difference between Lizotte and Dolan, Brians, Norrander and Wilcox, is that Lizotte did not directly say that Republican women and women in general are more “liberal”, but rather prefer similar perspectives, such as the government to take an “active” role. This researcher shows the difference between male and females when constructing how they view the government’s role and scope.
[5] With this secondary data research design, there are limitations. Since precincts chosen each year are completely random, this means that there could have been different precincts chosen each and every year, which means different types of voters are taking this survey and different precincts alone can vote differently than others. Even so, the voters who came out of the precincts may not have told the truth of who they voted for or shared certain information that could have impacted this secondary data.
[6] Just to note, the survey is not an exact proportional representation of the whole voting nation.
[7] According to the authors, 47 women candidates won House seats, 35 were Democratic women (Carpini and Fuchs 1993).
[8] Quantitative data from CNN and The New York Times shows that in 2000 to 2002 there was a 3 percent decrease in Republican women voters voting for Democratic House candidates from 9 percent to 6 percent, but from 2002 to 2006, the data shows a steady percentage of 6 percent (“Portrait of the Electorate: Table of Detailed Results” 2010; “CNNPolitics – Political News, Analysis and Opinion” 2014; “Exit Polls” 2014; “2018 Midterms: EXIT POLLING” 2018)/
[9] Liu and Jacobson are mentioned in this section and their citation can be found in the specific section, as well as the “References” section.
[10] Only 18 percent of respondents were factored into this, based off of the specific selection of Republican women and how they approve or disapprove of the President’s actions (“Polling Explorer” 2019).
[11] Pennsylvania is a swing state and also known as a state positioned up north. Swing state is a state that in elections has held both Republican and Democratic majorities/gone to either party in the electoral college in election cycles.
[12] Florida is a swing state that is positioned down South. The point of having a swing state from both the North and the South was to show that regardless of the location, Republican women voting in national elections will not make them more likely to vote for the Democratic candidates, regardless of the race.
References
“2018 Midterms: EXIT POLLING.” CNN. Accessed February 14, 2019. https://www.cnn.com/election/2018/exit-polls/national-results.
Abramowitz, Alan I., Brad Alexander, and Matthew Gunning. 2006. “Incumbency, Redistricting, and the Decline of Competition in U.S. House Elections.” The Journal of Politics 68, no. 1: 75-88. doi:10.1111/j.1468-2508.2006.00371.x.
Barnes, Tiffany D., and Erin C. Cassese. 2017. “American Party Women: A Look at the Gender Gap within Parties.” Political Research Quarterly 70, no. 1 (March): 127–41. doi:10.1177/1065912916675738.
Brians, Craig Leonard. 2005. “Women for Women?: Gender and Party Bias in Voting for Female Candidates.” American Politics Research 33, no. 3 (May): 357–75. doi:10.1177/1532673X04269415.
Carpini, Michael X. Delli, and Ester R. Fuchs. 1993. “The Year of the Woman? Candidates, Voters, and the 1992 Elections.” Political Science Quarterly 108, no. 1: 29. doi:10.2307/2152484.
“CNNPolitics – Political News, Analysis and Opinion.” CNN. February 27, 2014. Accessed February 14, 2019. https://www.cnn.com/politics.
Dolan, Kathleen A. 2004. Voting for Women: How the Public Evaluates Women Candidates. Boulder, CO: Westview.
“Exit Polls.” The New York Times. November 05, 2014. Accessed February 14, 2019. https://www.nytimes.com/interactive/2014/11/04/us/politics/2014-exit-polls.html?mtr ref=www.google.com&gwh=5A65CCBB5B0FD12777E940F1BF5472BC&gwt=pay.
Fiorina, Morris P., and Samuel J. Abrams. 2008. “Political Polarization in the American Public.” Annual Reviews 11 (June): 563-588.
Frederick, Brian. 2009. “Are Female House Members Still More Liberal in a Polarized Era? The Conditional Nature of the Relationship Between Descriptive and Substantive Representation.” Congress & the Presidency 36, no. 2: 181–202. https://doi.org/10.1080/07343460902948097.
Hayes, Danny, and Jennifer L. Lawless. 2016. Women on the Run: Gender, Media, and Political Campaigns in a Polarized Era, Cambridge University Press.
Liu, Huchen, and Gary C Jacobson. 2018. “Republican Candidates’ Positions on Donald Trump in the 2016 Congressional Elections: Strategies and Consequences.” Presidential Studies Quarterly 48, no. 1: 49-71. doi:10.1111/psq.12414.
Lizotte, Mary-Kate. 2017. “Gender, Partisanship, and Issue Gaps.” Analyses of Social Issues and Public Policy : ASAP 17, no. 1 (12, 2017): 379-405. doi:http://dx.doi.org.muhlenberg.idm.oclc.org/10.1111/asap.12144. https://muhlenberg.idm.oclc.org/login?url=https://search-proquest-com.muhlenberg.idm.oclc.org/docview/1980069195?accountid=40980.
Norrander, Barbara, and Clyde Wilcox. 2008. “The Gender Gap in Ideology.” Political Behavior 30, no. 4: 503-23. doi:10.1007/s11109-008-9061-1.
“Political Polarization in the American Public.” 2016. Pew Research Center for the People and the Press. October 11. Accessed February 15, 2019. http://www.people-press.org/2014/06/12/political-polarization-in-the-american-public/.
“Polling Explorer.” Reuters. Thomson Reuters. Accessed May 8, 2019. https://polling.reuters.com/#!response/CP3_2/type/week/filters/SEX:2,PARTY_ID_:2/dates/20180101-20190409/collapsed/true.
“Portrait of the Electorate: Table of Detailed Results.” 2010. The New York Times. November 06. Accessed February 14, 2019. https://archive.nytimes.com/www.nytimes.com/interactive/2010/11/07/weekinreview/ 20101107-detailed-exitpolls.html?_r=0.
Reingold, Beth, and Jessica Harrell. 2009. “The Impact of Descriptive Representation on Women’s Political Engagement: Does Party Matter?” Political Research Quarterly 63, no. 2: 280-94. doi:10.1177/1065912908330346.
Sanbonmatsu, Kira, and Kathleen Dolan. 2008. “Do Gender Stereotypes Transcend Party?” Political Research Quarterly 62, no. 3: 485-94. doi:10.1177/1065912908322416.
